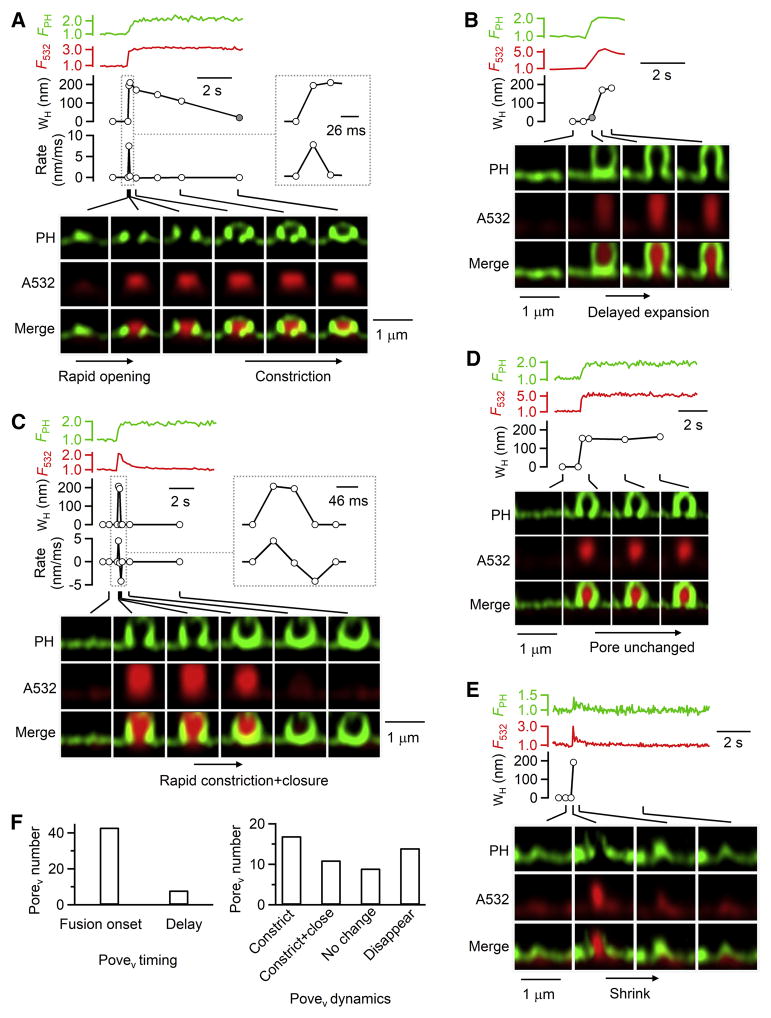
Figure 3. Fusion pore expansion, constriction and closure at different rates.
(A–E) PH-Ω fluorescence (FPH, normalized to baseline), A532 spot fluorescence (F532, normalized to baseline), Porev WH, and sampled images at times indicated with lines showing different Porev dynamics: A, rapid opening and slow constriction (same PH-Ω as in Figure 2H-iv); B, delayed expansion; C, rapid constriction and closure; D, Porev unchanged; E, Porev disappearance due to Ω-profile shrinking.
A and C: the rate of Porev WH changes (Rate) are plotted (A, 26 ms/frame; C, 46 ms/frame); insets, WH and Rate at larger time scale. Gray circles in A–B refer to non-visible A532-permeable pores with a WH <60 nm. Fusion was induced by depol1s at 0.1–2 s before PH-Ω appeared.
(F) Left, number of Porev observed at the fusion onset or 0.5–4 s after fusion (delay).
Right, number of Porev that subsequently constricted, constricted and closed, remained unchanged, or disappeared. Data from 51 Porev (49 cells, XZ/Yfix image every 26–300 ms).
See also Figures S2 and S4.

