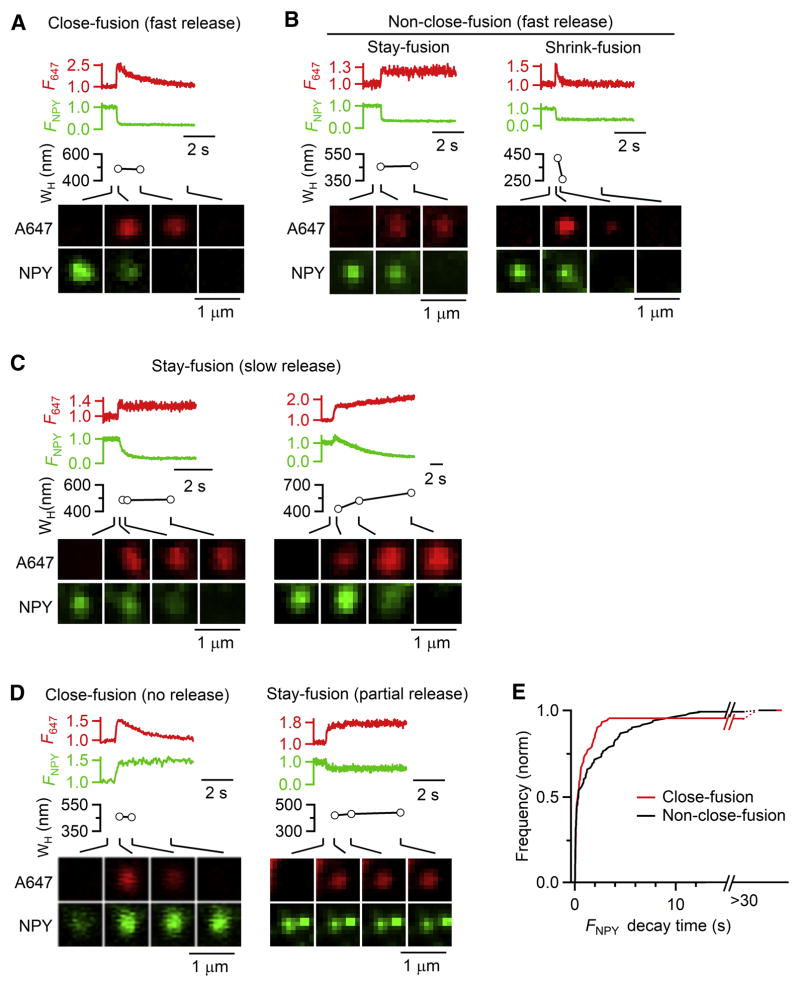
Figure 6. Most close-fusions release NPY-EGFP rapidly and completely as non-close-fusions.
(A–D) F647 (A647 spot fluorescence), FNPY (NPY-EGFP spot fluorescence), A647 spot WH, and A647/NPY-EGFP confocal XY-images at times indicated with lines for various fusion modes and rates of releasing NPY-EGFP. A, close-fusion with rapid release; B, non-close-fusion, including stay-fusion (left) and shrink-fusion (right) with rapid release; C, two stay-fusion spots with slow release; D, close-fusion (left) and stay-fusion (right) with no or partial release of NPY-EGFP.
(E) Cumulative frequency (normalized) of 20–80% FNPY decay time for close-fusion (95 spots, 28 cells) and non-close-fusion (123 spots, 28 cells, confocal XY/Zfix imaging). ‘>30 s’: partial or no NPY-EGFP release.

