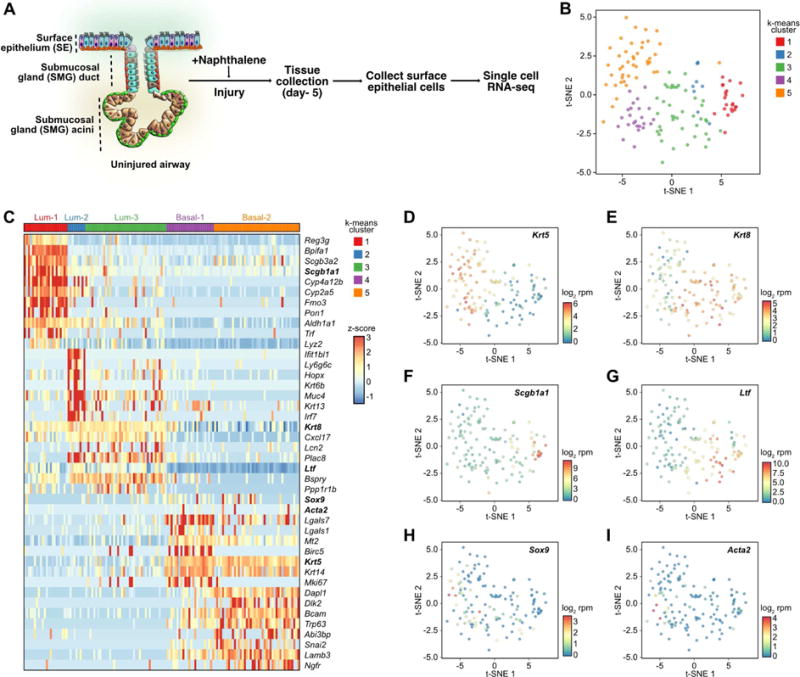
Figure 1. Single cell RNA-seq reveals a population of gland-like cells in the airway SE following naphthalene injury.

(A) Schematic of experimental design and single cell library preparation.
(B) t-SNE visualization of the single airway epithelial cells after naphthalene injury (n = 139 cells). Cells are color-coded by k-means clusters.
(C) Heat map of genes associated with the 5 clusters (Lum-1, Lum-2, Lum-3, Basal-1, and Basal-2). Values shown in terms of z-scores. Gene names in bold are individually featured in subsequent panels.
(D-I) t-SNE visualization of single airway epithelial cells after naphthalene injury (n = 139 cells). Cells are color coded by normalized expression of the indicated genes: (D) Krt5, (E) Krt8, (F) Scgb1a1, (G) Ltf, (lactoferrin) (H) Sox9, and (I) Acta2.
See also Figure S1.
