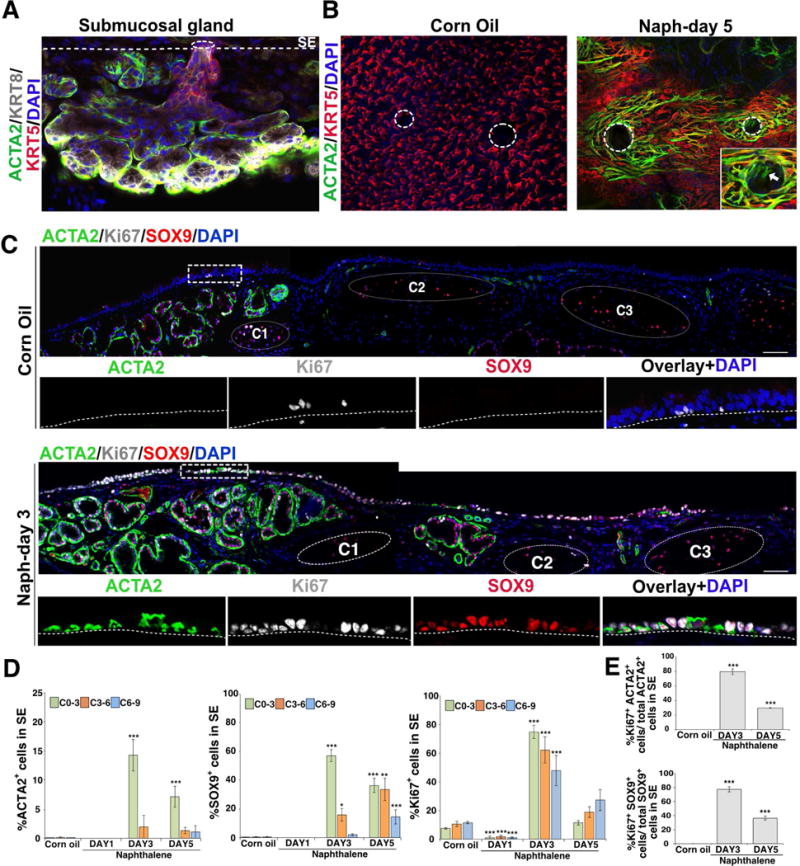
Figure 2. Airway luminal SE harbors cells expressing SMG cell markers following naphthalene-induced injury.

(A) Whole mount IHC of SMG for myoepithelial cell marker ACTA2 (green), basal cell marker KRT5 (red), luminal cell marker KRT8 (grey), and nuclear DAPI (blue). The dotted line indicates border between SMG and SE. Scale bar: 50μm.
(B) Whole mount IHC staining of tracheal SE in corn oil or naphthalene (naph) treated mice at day-5 after injury. ACTA2 (green), KRT5 (red), DAPI (blue). Dotted circles indicate gland pore opening. Higher magnification image of the gland pore is shown in inset right bottom. Scale bars: 50μm, n=3.
(C) Large panels: Tracheal sections from naphthalene exposed (day-3) or control (corn oil) mice stained for ACTA2 (green), SOX9 (red) and Ki67 proliferation marker (grey). Small panels: Single markers shown for regions delineated by dotted box. Dotted circles indicate cartilage rings marked as C1-C3. Scale bar: 50μm.
(D) Quantification of ACTA2+, SOX9+ and Ki67+ cells among total DAPI+ cells in SE in control and naph injured mice. Data are shown as mean ± SEM (n≥3 mice; *p ≤ 0.05; **p ≤ 0.01; ***p ≤ 0.001). C0-3, C3-6, and C6-9 refers to SE spanning cartilage rings between 0-3 or cartilage 3-6 or cartilage 6-9, respectively.
(E) Quantification of ACTA2+, SOX9+ co-expressing Ki67+ cells in SE of control and day-3 and day-5 post naph injury. Data shown as mean ± SEM (n=3; ***p ≤ 0.001). p-values were determined compared to controls.
See also Figure S1 and Figure S2.
