
Figure 1. Identification of key EZH2 and EED residues required for allosteric activation of PRC2.
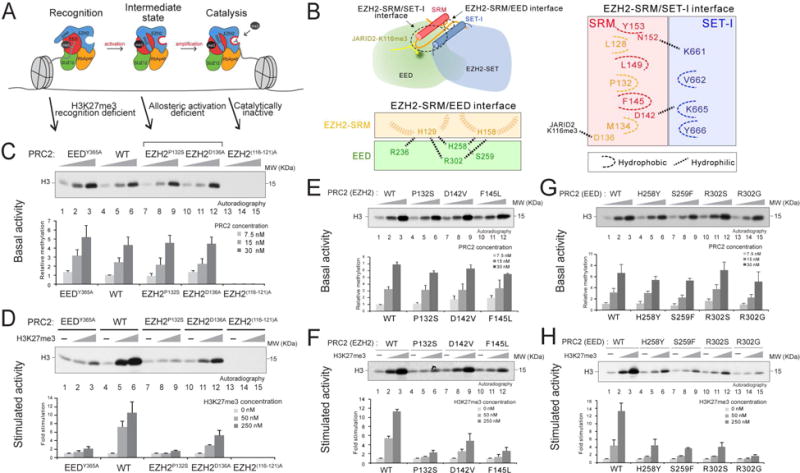
(A) Illustration of the stepwise model of H3K27me3-potentiated positive feedback activation of PRC2, including the initial recognition step (EED binding to H3K27me3), the intermediate state (EZH2-SRM and SET-I ordering), and the substrate binding step (catalysis). Arrows indicate the corresponding PRC2 mutants for the dissection of each step within the model.
(B) Illustration of the EZH2-SRM/SET-I and EZH2-SRM/EED interfaces (left-top). Residues that mediate the interaction within the EZH2-SRM/EED interface (left-bottom) or within the EZH2-SRM/SET-I interface (right) are highlighted. Note that the numbers of EZH2 residues are based on human EZH2 isoform a (751 amino acids). Hydrophobic interactions are marked as dashed curvy lines and hydrophilic interactions as dashed linear lines.
(C-H) Histone methyltransferase assays. Bar plots were presented as Mean±SD (n=3 for each data point).
(C and D) HMT assays using wild-type (WT) PRC2 or mutant PRC2, as indicated, with unmodified oligonucleosomes (150 nM) as substrate. (C) Top, a representative HMT assay measuring the basal activity of PRC2. HMT assays were performed with an increasing amount of PRC2 (7.5, 15, or 30 nM) in the absence of the H3K27me3 stimulatory peptide (amino acids 21-44), as illustrated in the panel. The levels of methylation on histone H3K27 are shown by autoradiography. (D) Top, representative assay measuring the stimulated activity of PRC2. HMT assays were performed using 15 nM PRC2 without or with an increasing amount of the H3K27me3 peptide (50 or 250 nM). (C-D) Bottom, Quantification of the relative amounts of 3H-SAM incorporated into histone H3 after 60 min incubation of the assays described in Top panel.
(E and F) HMT assays using WT PRC2 or PRC2 containing EZH2-SRM mutants. Top, Representative HMT assay measuring the basal activity (panel E) and the stimulated activity (panel F) of PRC2 with the experimental conditions described in panel (C-D). Bottom, Quantification of the assays described in Top panel.
(G and H) HMT assay using WT PRC2 or PRC2 containing EED anchoring mutants. Top, Representative HMT assay measuring the basal activity (panel G) and the stimulated activity (panel H) of PRC2 under the experimental conditions described in panel (C-D). Bottom, Quantification of the assays described in Top panel.