
Figure 3. The activity of PRC2 is independent of its recruitment to chromatin.
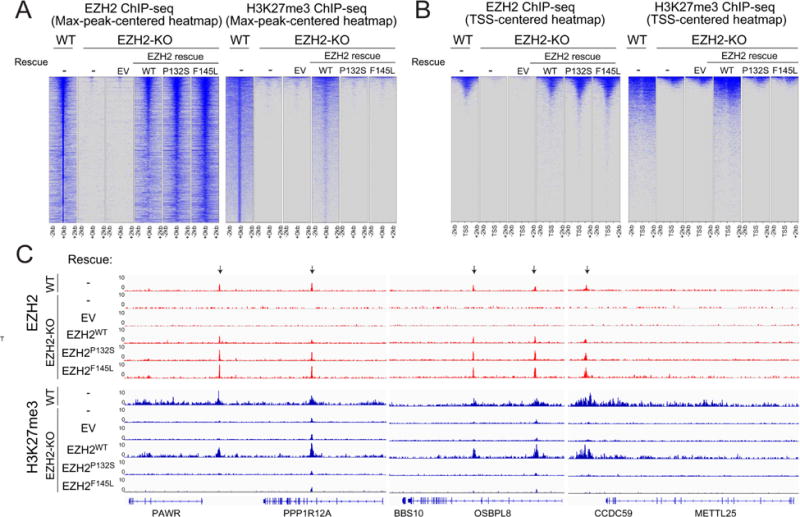
(A and B) Heatmaps representing EZH2 (left panels) or H3K27me3 (right panels) ChIP-seq peaks centered by maximum peak intensity at the genome-wide scale (A) or ~29000 UCSC annotated transcription start sites (TSS) and (B) in 4-kb windows within 200 bp bin size. The genotypes of E14 mESC for each experimental condition are indicated above each panel. WT, wild-type. KO, knockout. EV, empty vector.
(C) Representative track images for EZH2 (in red) and H3K27me3 (in blue) ChIP-seq experiments performed in panel (A and B) are shown for a select group of annotated genes. The UCSC annotations of exons and gene bodies are shown at the bottom. Arrows indicate the MACS peaks with FDR <5% in the respective windows. The scale of the peaks ranges from 0-10 reads per 10 million reads, with spike-in normalization using Drosophila chromatin and Drosophila H2A.X antibody in each ChIP reaction.