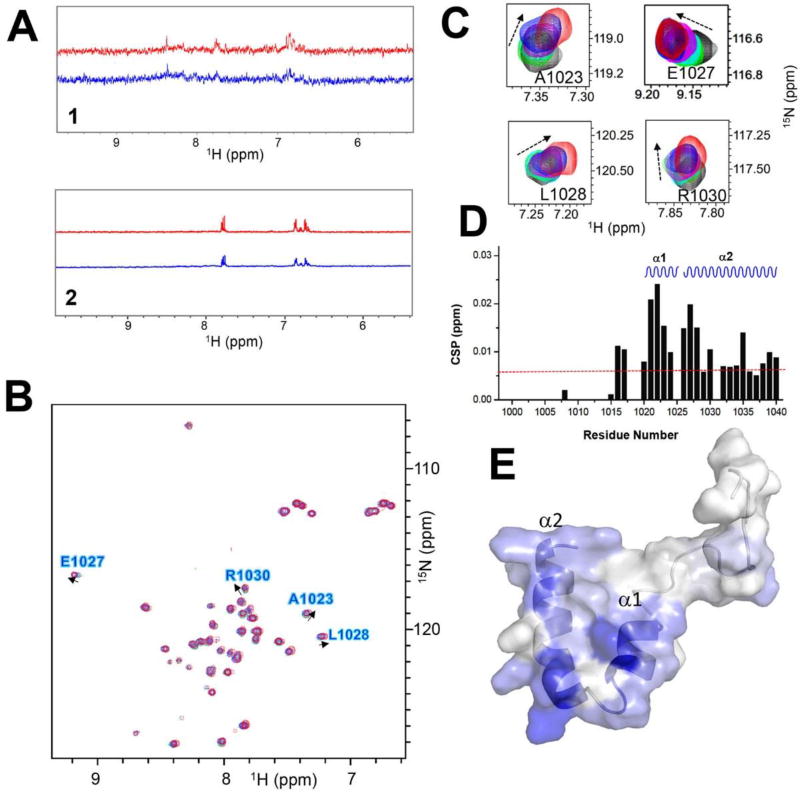
Figure 4.
Compounds 1 and 2 bind to REV1 UBM2. A: One-dimensional proton spectra of 1 (upper) and 2 (lower) with REV1 UBM2 protein. Red trace indicates the 1D reference spectrum of each compound. Blue trace indicates the STD spectrum of each compound. B: Superposition of the 2D [1H, 15N]-HSQC spectra of REV1 UBM2 with 2 at different molar ratios: 1:0 (black), 1:2 (green), 1:4 (cyan), 1:6 (magenta), 1:8 (blue), and 1:10 (red). Arrows show the direction of perturbation. C: Selected peaks from the HSQC spectra are enlarged. D: Chemical shift perturbations (CSPs) are plotted as a function of the residue number for REV1 UBM2 with 2 at molar ratio 1:10. The secondary structure elements in the REV1 UBM2 are indicated at the top: α1-helices 1 and α2-helices 2. The CSP, with the average value of 0.006 displayed as a red dotted line. E: Assignment of CSP on the NMR structure of free REV1 UBM2 (6AXD.pdb) in a cartoon-embedded surface model. The secondary structure elements are indicated. Residues are colored on a blue (largest) to white (zero) gradient based on the CSP value.

