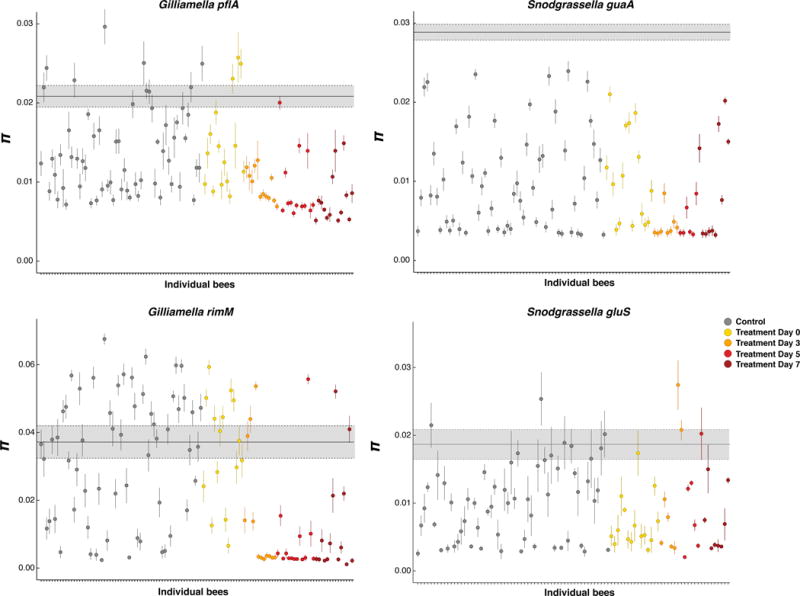
Figure 2.

Allelic diversity of populations of G. apicola and S. alvi in individual bees compared to the entire population for each gene marker. The average nucleotide diversity (π) for each population within individual bee (dots) was compared to the average nucleotide diversity across all the populations found in all control and treated bees (gray box). For each bee bacterial population, the circle represents the average π estimate (100 sequences were randomly sampled 100 times, and π was defined as the average across the 100 estimates); vertical lines show the standard deviation. The bold gray horizontal line indicates the average nucleotide diversity of the entire population (average nucleotide diversity of G. apicola and S. alvi computed across all control and treated bees), with the gray shading representing the standard deviation. All the populations from control bees are shown in gray circles and the populations from treated bees are colored by sampling day post-treatment.
