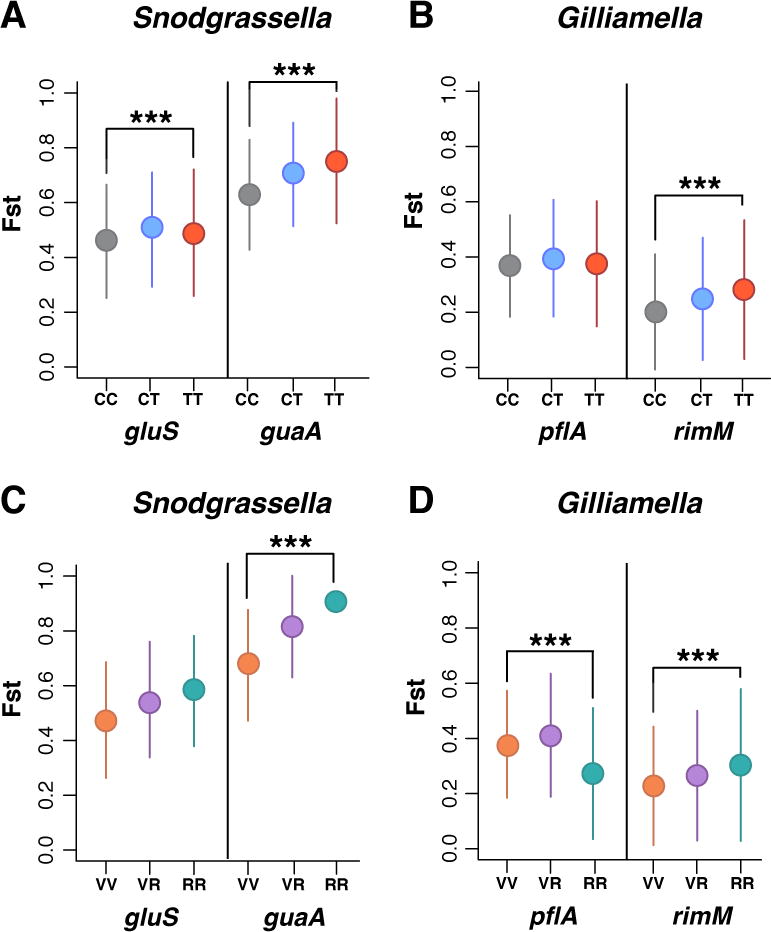
Figure 4.

Effect of antibiotic treatment on population differentiation. Fixation index (Fst) between different populations of S. alvi and G. apicola from individual bees. (A–B) Fst between all control and treatment bees: Control/Control (CC), Control/Treatment (CT), and Treatment/Treatment (TT). (C–D) Fst between vulnerable and robust bees: Vulnerable/Vulnerable (VV), Vulnerable/Robust (VR), and Robust/Robust (RR). Circles represent median Fst values; vertical lines indicate standard deviation. *** = P < 0.0001, Wilcoxon test.
