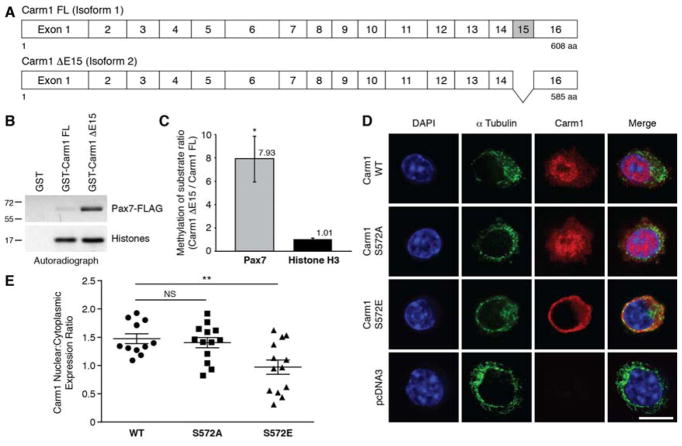
Figure 3. Phosphorylation of Carm1 by p38γ Restricts Carm1 Subcellular Localization to the Cytoplasm.
(A) Schematic of Carm1 FL (isoform 1) and Carm1 ΔE15 (isoform 2).
(B) In vitro methylation assays with GST-Carm1 FL or GST-Carm1 ΔE15 with Pax7 or core histone proteins.
(C) Densitometric quantification of (B), represented as the mean (n = 3 replicates) ± SEM (*p ≤ 0.05).
(D) Immunostaining of Carm1-null primary myoblasts transfected with either wild type, S572A, or S572E Carm1, or pcDNA3. Cells were immunostained with α-tubulin (green), Carm1 (red), and nuclei were counterstained with DAPI (blue). Scale bar represents 10 μm.
(E) Quantification of the mean fluorescence intensity of Carm1 expression in the nucleus and cytoplasm from the immunostaining performed in (D) and expressed as a nucleus:cytoplasm expression ratio, represented as the mean (n = 11 WT, n = 13 S572A, n = 13 S572E cells) ± SEM (**p ≤ 0.01. NS, not significant).
See also Figure S3.

