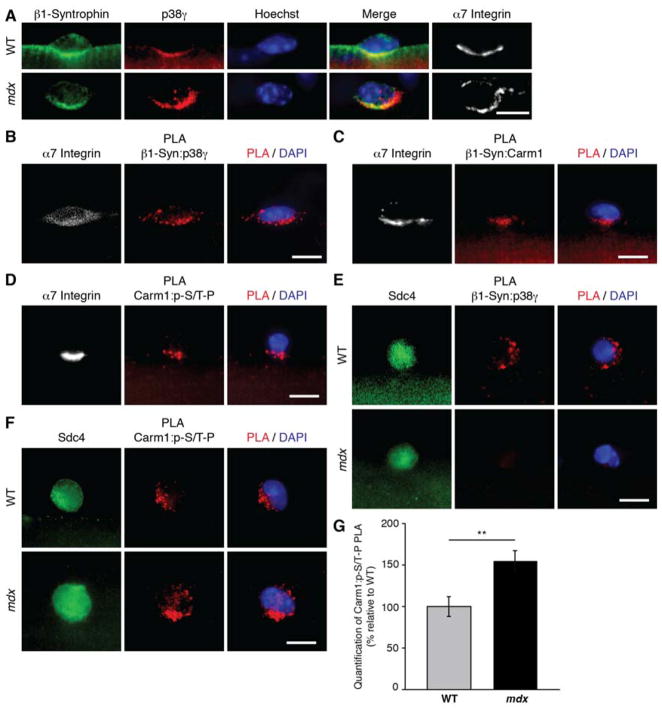
Figure 6. p38γ/Carm1 interacts with β1-Syntrophin in Satellite Cells.
(A) Immunofluorescence of satellite cells cultured for 36h on myofibers isolated from wild type (WT) or mdx mice. Cells were immunostained for α7 integrin (white), β1-syntrophin (green), and p38γ (red). Nuclei were counterstained with Hoechst (blue). Scale bar represents 10 μm.
(B, C, and D) PLA with indicated antibodies (red) performed on satellite cells cultured for 36h on single EDL myofibers. Satellite cells were identified by their expression of α7 integrin (white) and nuclei were counterstained with DAPI (blue). Scale bar represents 10 μm.
(E, and F) PLA with indicated antibodies (red) performed on satellite cells cultured for 36h on single myofibers isolated from either WT or mdx mice. Satellite cells were identified by their expression of Sdc4 (green) and nuclei were counterstained with DAPI (blue). Scale bar represents 10 μm.
(G) Quantification of PLA in (F), represented as the relative mean (n = 21 WT, n = 26 mdx cells from 3 mice) ± SEM (**p ≤ 0.01). The PLA was quantified by measuring mean fluorescence intensity of the PLA signal for each satellite cell.
See also Figures S6 and S7.

