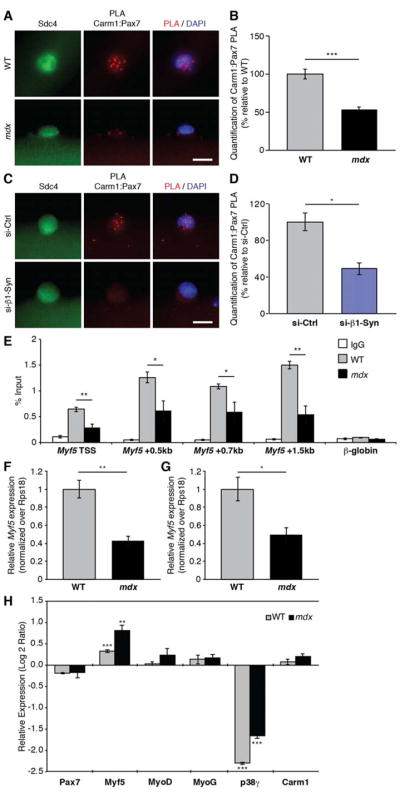
Figure 7. Carm1-Mediated Epigenetic Regulation of Myf5 Expression is Altered in mdx Cells.

(A) Carm1:Pax7 PLA (red) performed on satellite cells cultured for 36h on single myofibers isolated from either wild type (WT) or mdx mice. Satellite cells were identified by their expression of Sdc4 (green) and nuclei were counterstained with DAPI (blue). Scale bar represents 10 μm.
(B) Quantification of PLA in (A), represented as the relative mean (n = 81 WT, n = 137 mdx cells from 3 mice) ± SEM (***p ≤ 0.001). The PLA was quantified by counting the number of nuclear PLA puncta for each satellite cell.
(C) Carm1:Pax7 PLA (red) performed on satellite cells cultured for 36h on myofibers that were treated with either control or β1-syntrophin siRNA. Satellite cells are marked by expression of Sdc4 (green) and nuclei were counterstained with DAPI (blue). Scale bar represents 10 μm.
(D) Quantification of PLA in (C), represented as the relative mean (n = 53 si-Ctrl, n = 73 si-SNTB1 cells from 3 mice) ± SEM (*p ≤ 0.05). The PLA was quantified by counting the number of nuclear PLA puncta for each satellite cell.
(E) Chromatin immunoprecipitation (ChIP)-qPCR analysis of H3K4me3 at Myf5 in WT and mdx primary myoblasts represented as the mean (n = 4 WT, n = 4 mdx mice) ± SEM (*p ≤ 0.05, **p ≤ 0.01).
(F) RT-qPCR analysis of Myf5 expression in freshly sorted satellite cells from WT and mdx mice represented as the mean (n = 3 WT, n = 4 mdx mice) ± SEM (**p ≤ 0.01).
(G) RT-qPCR analysis of Myf5 expression in WT and mdx primary myoblasts represented as the mean (n = 11 WT, n = 4 mdx mice) ± SEM (*p ≤ 0.05).
(H) RT-qPCR analysis of indicated genes in satellite cell-derived primary myoblasts isolated from WT and mdx mice that were treated with control and p38γ siRNA. Fold changes are shown relative to control siRNA-treated cells on a log base 2 axis and are represented as the mean (n = 3 replicates from 3 mice) ± SEM (**p ≤ 0.01, ***p ≤ 0.001).
See also Figure S7.
