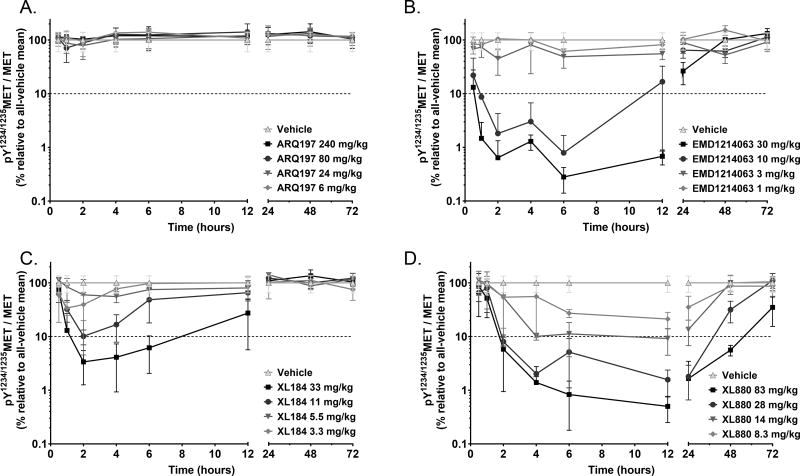
Figure 1.
Time course of MET kinase PD biomarker response (pY1234/1235MET/MET reduction) to single-dose [A] ARQ197, [B] EMD1214063, [C] XL184, and [D] XL880 at increasing dose levels in the SNU-5 xenograft model. The x-axis indicates time after drug administration and is split for resolution. The log-scale y-axis indicates the mean PD biomarker value in each treated group relative to the all-vehicle mean (the 90% inhibition threshold is indicated by the dotted line). Error bars represent SD (n = 3 animals per group).

