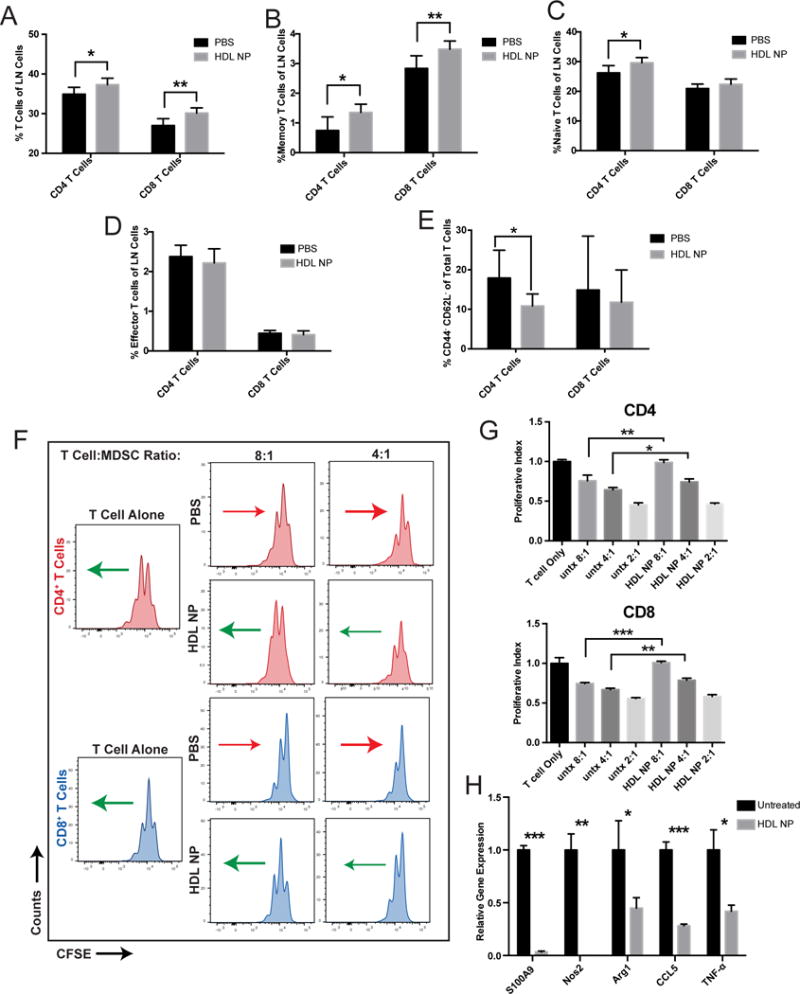
Figure 2.

HDL NP treatment modulates systemic T cell distributions and inhibits MDSC suppression. A, After treating WT mice with either PBS or HDL NP (3×/week for 1 week), immune cell distributions in lymph nodes were analyzed by flow cytometry to quantify CD4+ and CD8+ T cells with regard to total T cells of each subtype, B, memory T cells, C, naïve T cells, D, effector T cells, E, and CD62L−CD44− naïve T cells. F, After CFSE staining, T cells were stimulated using anti-CD3/CD28 conjugated beads and co-cultured for 48 hours with isolated MDSCs at 4:1 and 8:1 ratios (T cells:MDSC) isolated from mice treated with HDL NP or PBS. Flow cytometry determined CFSE labeling in CD4+ and CD8+ T cells in order to evaluate suppressive effects of MDSCs. Arrows represent the general shift (red = less proliferation and green = more proliferation) in the CFSE signal of the cell population relative to its PBS or HDL NP treated counterpart. G, Quantification of the proliferative index, defined by the normalized number of T cell proliferations in F. H, After treating MDSCs with HDL NPs, gene expression was quantified by RT-PCR for S100A9, NOS2, Arg1, CCL5 and TNF-α with comparison made to PBS treated control MDSCs. A-H, P values: *P < 0.05, **P < 0.01 and ***P < 0.001 by two-tailed T test.
