
Figure 2. In vivo 800 nm fluorescence imaging studies using CyEt-Pan-Duo.
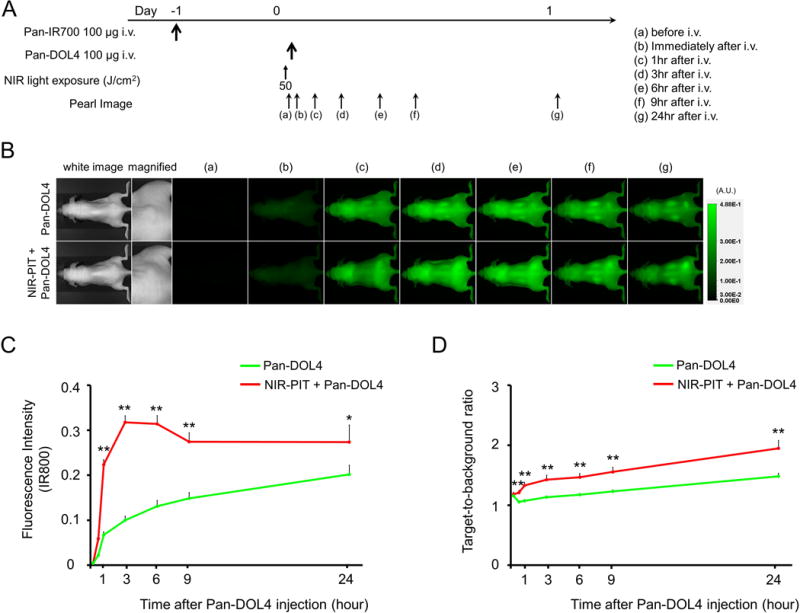
(A) The regimen of imaging is shown. Fluorescence images were obtained at each time point as indicated. (B) In vivo 800 nm fluorescence real-time imaging of tumor-bearing mice (right dorsum). The tumor showed high fluorescence intensity after CyEt-Pan-Duo injection and the 800 nm intensity in both CyEt-Pan-Duo only tumor and NIR-PIT + CyEt-Pan-Duo tumor. The 800 nm fluorescence signal was higher in NIR-PIT + CyEt-Pan-Duo group compared to CyEt-Pan-Duo only group. (C) Quantitative analysis of 800 nm fluorescence intensities in tumors (n = 10). The 800 nm fluorescence intensity in NIR-PIT + CyEt-Pan-Duo tumors showed continuously high intensities within 1 day after injection. On the other hand, the 800 nm fluorescence intensity in the CyEt-Pan-Duo only tumors increased gradually within 1 day. The 800 nm fluorescence intensities were significantly higher in NIR-PIT + CyEt-Pan-Duo group compared to CyEt-Pan-Duo only group at the most time points (**, p < 0.01 at 1, 3, 6, and 9 hour, p < 0.05 at 24 hour, by Mann-Whitney-U test). (D) Quantitative analysis of TBR in tumors (n = 10). TBR increased gradually within 24 hour in both CyEt-Pan-Duo only tumors and NIR-PIT + CyEt-Pan-Duo tumors. TBRs were significantly higher in NIR-PIT + CyEt-Pan-Duo group compared to CyEt-Pan-Duo only group at all time points (**, p < 0.01, by Mann-Whitney-U test).