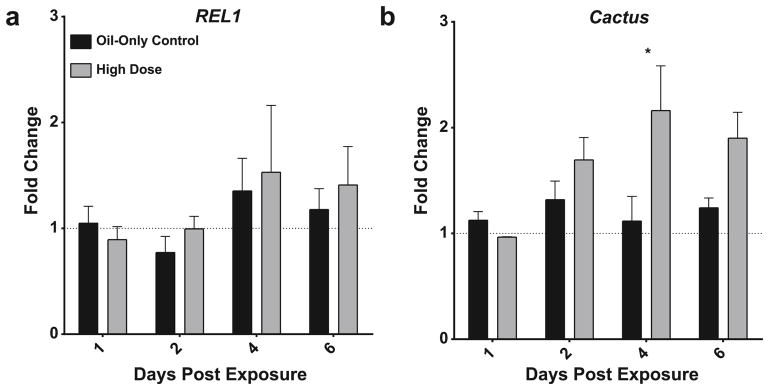
Figure 2. Time course of REL1 and Cactus expression following B. bassiana exposure.
Relative expression of An. gambiae REL1 and Cactus transcripts after exposing female mosquitoes to a high dose of B. bassiana strain I93-825. Graphs depict mean transcript levels at 1, 2, 4, and 6 dpe for oil only controls (black) and high dose, B. bassiana-exposed mosquitoes (grey). RT-qPCR results were analyzed using rpS7 as the reference gene and untreated mosquitoes collected at 0 dpe as calibrator condition. Statistically significant differences are indicated by asterisks (Wilkoxon signed-rank test, Sidak’s post test, P < 0.05). Data are presented as mean ± 1 SEM from four (REL1) and five (Cactus) biological replicates; individual replicates are shown in Fig. S3.

