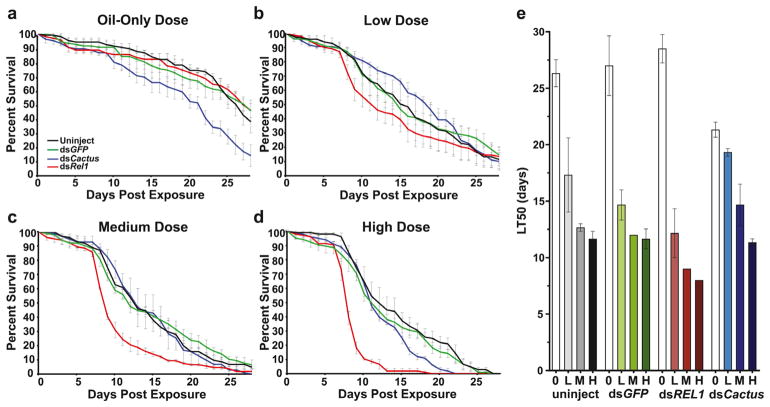
Figure 3. Survival of female dsREL1- or dsCactus-injected mosquitoes following exposure to B. bassiana I93-825.
(a–d) Survival curves of mosquitoes after exposure to B. bassiana strain I93-825 at indicated doses. At each dose, curves represent survival over time of the following treatment groups: black, no injection; green, dsGFP-injected; blue, dsCactus-injected; red, dsREL1-injected. (e) LT50 after B. bassiana exposures following no injection (uninject), dsGFP-, dsREL1-, and dsCactus injection, respectively, after exposure to oil only control (O), low (L), medium (M), and high (H) dose exposures. Data were combined from three biological replicates (Fig. S5) and are presented as mean ± 1 SEM.

