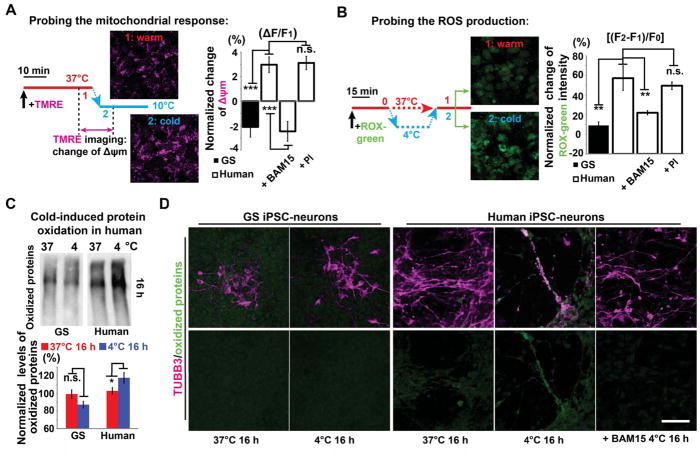
Figure 3. Cold-induced Mitochondrial Hyperpolarization and Oxidative Stress in Human iPSC-neurons.
(A) Live cell imaging protocol (left) of mitochondrial membrane potential (Δψm) with TMRE (see STAR METHODS), and quantification (right) of cold-induced Δψm changes in GS and human iPSC-neurons untreated controls, and treated with BAM15 or PI (n = 8 experiments; Student’s t-test between GS and human controls; ANOVA plus post hoc Tukey test for multiple human cold-exposed groups with or without drug treatment; *** p < 0.001; n.s. p > 0.05, not significant). BAM15: a mitochondrial uncoupling drug; PI: protease inhibitors. See also Movie S1.
(B) CellROX green imaging protocol (left) to assess cold-induced ROS production (see STAR METHODS), and quantification (right) of ROS production following 30-min cold exposure in GS and human iPSC-neurons (n = 8 experiments; Student’s t-test between GS and human comparisons; ANOVA plus post hoc Tukey test for multiple human cold-exposed groups with or without drug treatment; ** p < 0.01; n.s. p > 0.05, not significant).
(C) Western blots and quantification of oxidized proteins following 16-h incubation at 4°C (n = 5 experiments; Student’s t-test for two-group comparisons; * p < 0.05).
(D) Immunofluorescence of TUBB3 (magenta) and oxidized proteins (green). Note: after 16-h incubation at 4°C, minimal protein oxidation was detected on GS TUBB3+ processes even with digital enhancement, while in human neurons oxidized proteins were found on residual TUBB3+ microtubules, which could be reduced or completely mitigated by BAM15 treatment (n = 5 experiments). Scale bar: 50 μm. See also Figure S4. For all experiments in this figure, neurons were derived from 2 GS and 3 human iPSC lines for each group.

