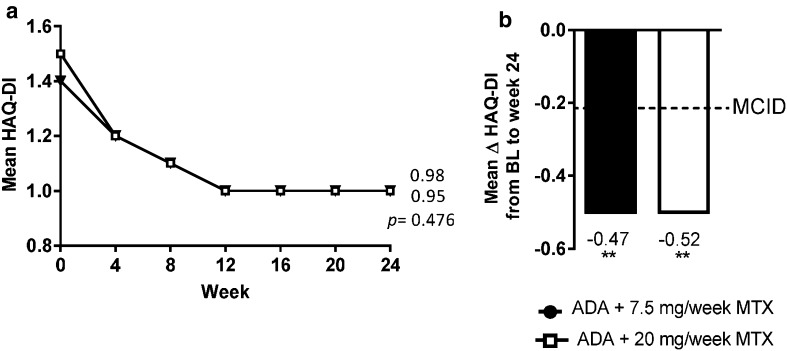
Fig. 1.
a Physical function (HAQ-DI) over time. p values for comparison between MTX dosage groups at week 24 (ANCOVA). b Mean change in physical function from baseline to week 24. **p < 0.001, comparison between scores at baseline and at week 24 (t test) for each MTX dosage group. Reprinted from the 2014 ACR/ARHP Annual Meeting held November 14–19, 2014. The American College of Rheumatology does not guarantee, warrant, or endorse any commercial products or services

