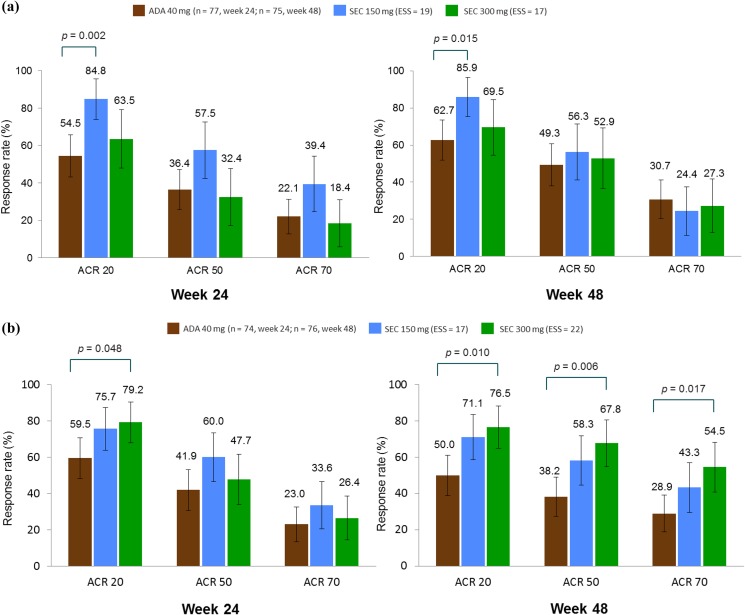
Fig. 4.
Methotrexate subgroup analysis: MAIC-predicted ACR response rates at weeks 24 and 48 in patients (a) receiving and (b) not receiving methotrexate at baseline. P values are derived from RR values. Error bars show 95% confidence intervals. Numbers above bars show the absolute mean predicted responses (ADEPT) and the predicted mean responses (FUTURE 2). ACR 20/50/70 20%/50%/70% or greater improvement in the American College of Rheumatology response criteria, ADA adalimumab, ESS effective sample size, MAIC matching-adjusted indirect comparison, RR relative risk, SEC secukinumab

