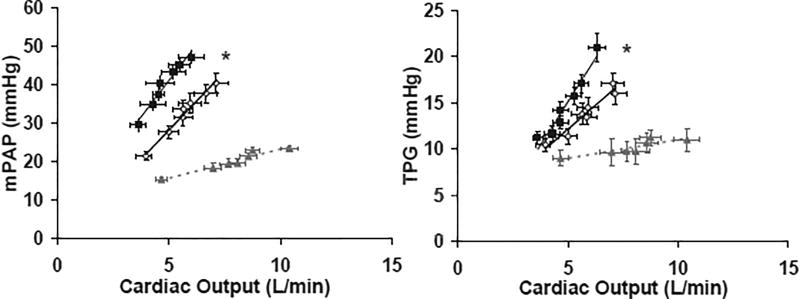
Figure 3.
Pressure-flow relationship of right ventricular-pulmonary vascular (RV-PV) unit (A) and incremental pulmonary vascular resistance (B) during exercise for patients with HF, stratified by mean response time (MRT) and control subjects. The pressure-flow relationship (pulmonary artery pressure vs. cardiac output [A] and trans-pulmonary gradient vs. cardiac output [B]) were assessed at rest and each minute of a standardized 6-minute exercise protocol. Shown are averages across all subjects within each group. PAP, pulmonary artery pressure; TPG, trans-pulmonary gradient. * Indicates p<0.05 for comparison of average hemodynamic measurements during exercise for MRT < 60 sec vs. MRT ≥ 60 sec.

