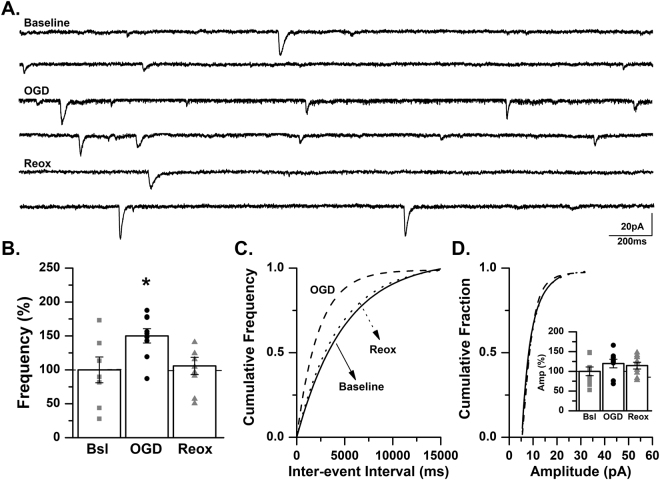
Figure 7.
mEPSC frequency is significantly increased in CA3 pyramidal cells during OGD. (A) Representative traces from a control C57BL/6 mouse recorded at baseline, during OGD and during reoxygenation (reox) demonstrating an increase in mEPSC frequency during OGD. (B) Averaged data demonstrating that mEPSC frequency is significantly increased during OGD and returns to baseline levels during reox as a percent of baseline (n = 9 cells, 7 animals; baseline, Bsl: 0.5 ± 0.1 Hz; OGD: 0.72 ± 0.14 Hz; reox: 0.45 ± 0.06 Hz). *p < 0.05, K-W ANOVA. Data presented as percent mean ± SEM. (C) Representative inter-event cumulative frequency histogram demonstrating a reduction in the inter-event interval during OGD. (D) Representative amplitude cumulative histogram demonstrating no change in mEPSC amplitude during OGD (baseline, Bsl: 14.2 ± 1.58 pA; OGD: 16.14 ± 1.54 pA; reox: 15.8 ± 1.91 pA). Inset showing averaged data for mEPSC amplitude at baseline, during OGD and during reox. Data presented as percent mean ± SEM. Baseline, solid line; OGD, dashed line; reox, dotted line.

