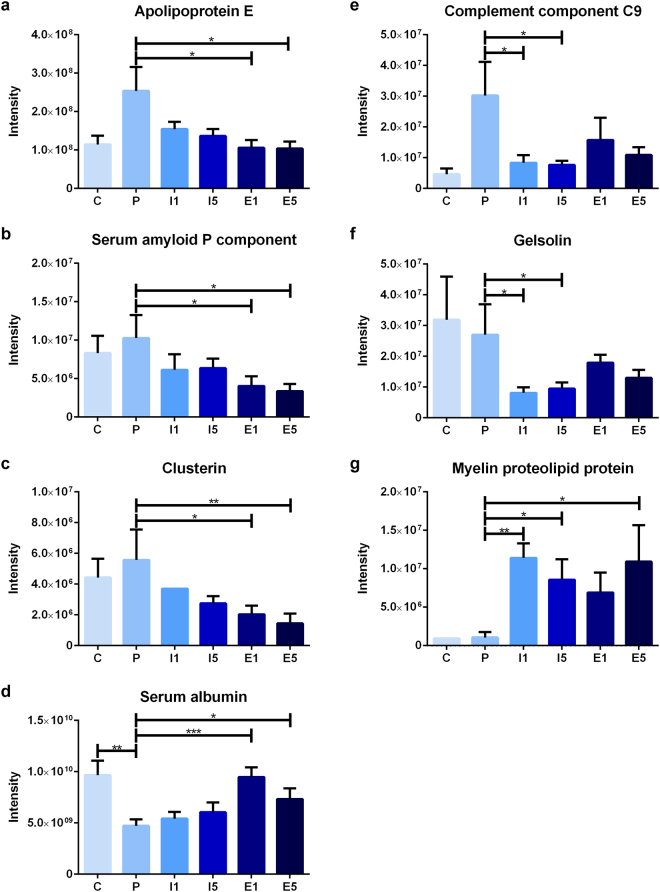
Figure 5.
Intensity of immunoprecipitated protein for all groups; apolipoprotein E (a), serum amyloid P component (b), clusterin (c), serum albumin (d), complement component C9 (e), gelsolin (f) and myelin proteolipid protein (g); control (C, n = 5), placebo (P, n = 10), IFN-β on day 1 (I1, n = 10), IFN-β on day 5 (I5, n = 10), etomoxir on day 1 (E1, n = 10) and etomoxir on day 5 (E5, n = 10). All data are presented as the mean ± SEM. Results from the unpaired t-tests showed statistically significant differences in the immunoprecipitated protein intensities between P and E1 and E5 (a–d) and between P and I1 and I5 (e–g). Number of asterisks indicates level of statistical significance (*p < 0.05, **p < 0.01 and ***p < 0.001).

