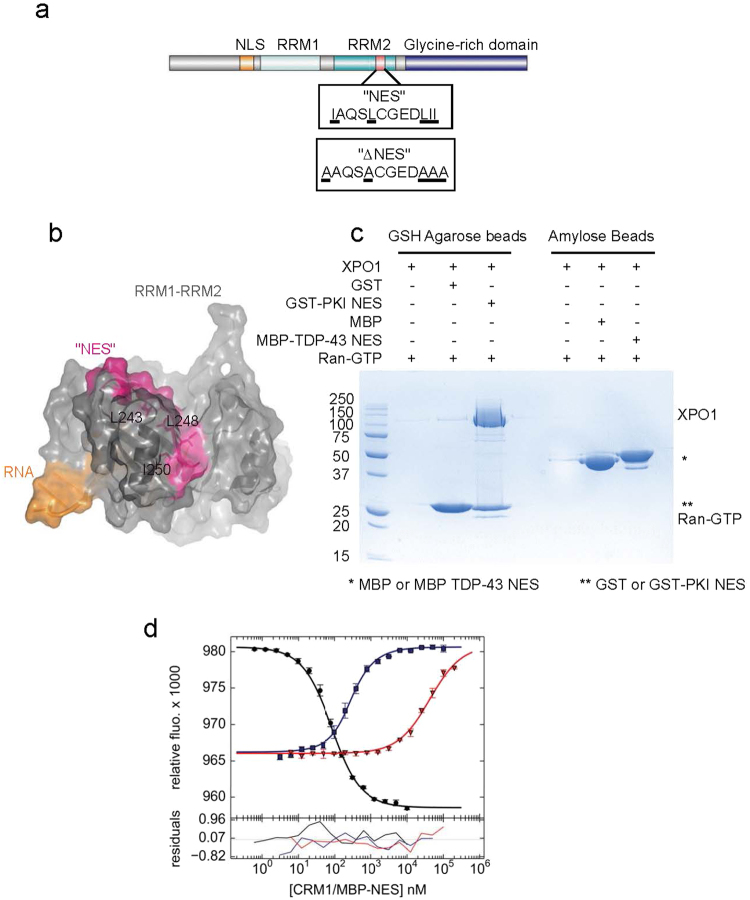
Figure 1.
The putative NES in TDP-43 is not solvent exposed and has weak affinity for XPO1. (a) Domain organization of TDP-43, formatted using IBS Cuckoo43. NLS: Nuclear Localization Signal, residues 82–98. RRM1: RNA Recognition Motif 1, residues 106–165. RRM2: RNA Recognition Motif 2, residues 191–257. “NES”: putative Nuclear Export Signal, residues 239–250. “∆NES”: set of point mutations reported to disrupt putative NES, I239A, L243, L248A, I249A, I250A18. Glycine-Rich domain: residues 270–414. (b) NMR solution structure of the TDP RNA binding domain (RRM1-RRM2)20. Shown is the cartoon overlaid by a partly transparent solvent accessible surface. Residues comprising the putative NES have been colored magenta. The side chains of some critical hydrophobic residues – L243, L248, and I250 – are shown as sticks. (c) In vitro pull-down assay (Coomassie/SDS-PAGE) of purified human XPO1 binding to immobilized GST-NESPKI (on GSH agarose beads) or MBP- NESTDP (on amylose beads) in the presence of Ran-GTP (GSP1(179ter, Q71L)). (d) Competition differential bleaching assay. Binding of FITC-NESPKI to XPO1 in the presence of excess RanGTP (GSP1 (179ter, Q71L)), measured by differential bleaching (blue line) Bleaching of a fluorescently labeled control NES, FITC-NESPKI, decreases with increasing XPO1 concentration (black line). MBP-NESPKI competes with FITC-NESPKI for XPO1 binding (blue line). MBP-NESTDP-43 poorly competes with FITC-NESPKI for XPO1 binding (red line). Relative fluorescence of triplicate experiments are plotted on top with data points representing mean and standard deviation. Data fit residuals are plotted below.

