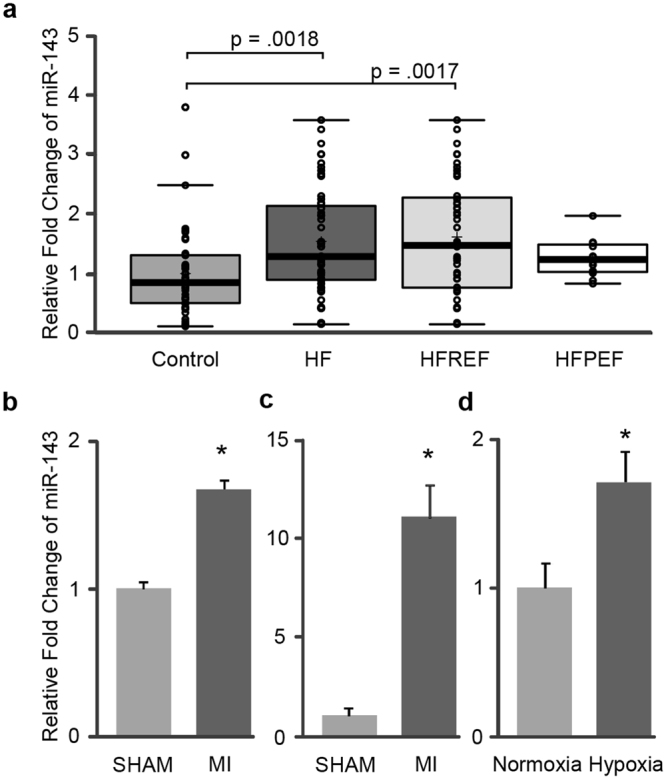
Figure 1.

Expression of miR-143 in human HF plasma, animal model and in vitro experimental platforms. (a) Upregulation of miR-143 in HF plasma compared with non-HF controls. In the Box and Whisker plot, center lines represent the median; lower and upper box limits indicate the 25th and 75th percentiles respectively, crosses represent sample means; data points are plotted as open circles. n = 42, 56, 44, 12 for control, HF, HFREF and HFPEF respectively. Student’s t test, p values as indicated. Relative expression levels of miR-143 in (b) rat plasma and (c) rat left ventricular tissue at 7 days post-surgery as compared to sham controls (n = 6). (d) Expression of miR-143 in HCMa cells after 48 h hypoxic treatment. Data in (b,c and d) are presented as mean ± SD, Student’s t test, *p < 0.05.
