
Fig. 2.
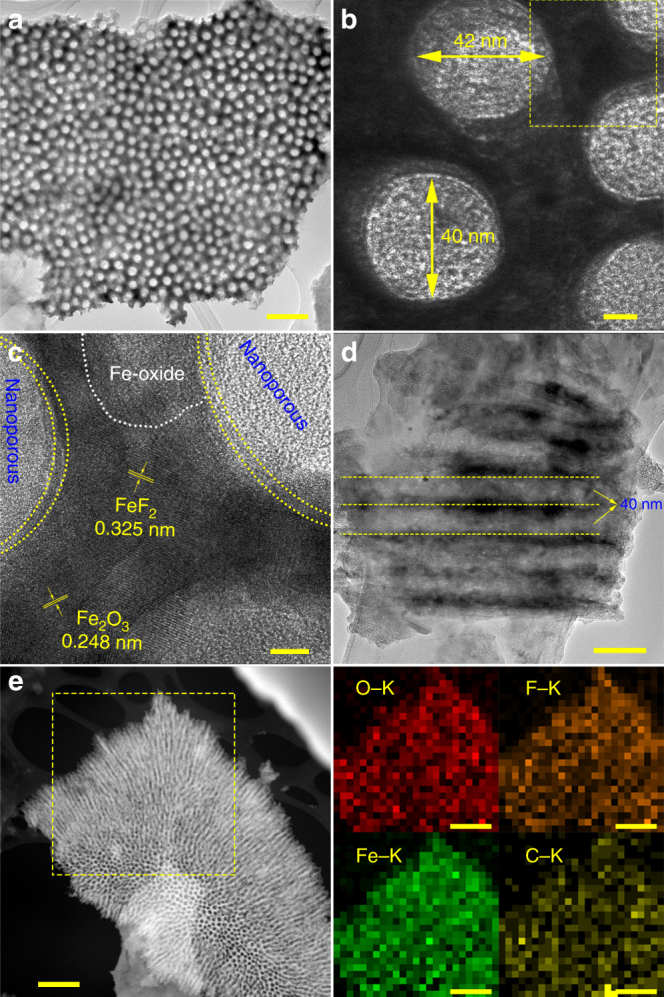
Microscopic morphology and chemical composition of IFONFs-45. a TEM top-view images of IFONFs-45. Scale bar, 200 nm. b, c HRTEM images of IFONFs-45. Besides amorphous nanodomains, the lattice fringes with spacing of ~0.325 and 0.248 nm ascribed to FeF2 (110) and Fe2O3 (400), respectively, are clearly visible, indicating crystallinity of iron fluoride-oxide nanostructure. The nanopores, together with fine nanograins of iron fluoride-oxide and thin amorphously shells are uniformly distributed in the porous network, ensuring IFONFs-45 has more accessible sites for electrochemical reactions. Scale bar, 10 and 5 nm, respectively. d TEM cross-sectional image of IFONFs-45. Scale bar, 100 nm. e STEM elemental mapping of IFONFs-45. Scale bar, 500 nm