Figure 3.
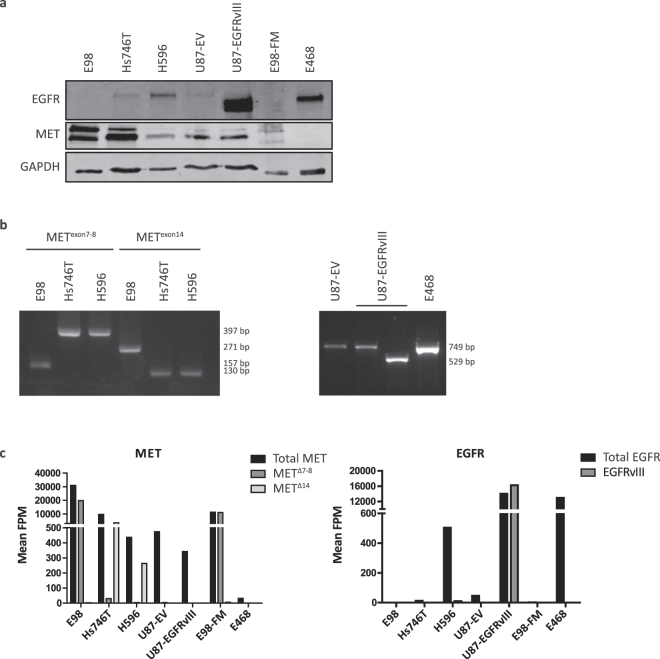
Expression levels and mutation status of MET and EGFR in relevant cell lines and xenografts. (a) western blot of cell lines E98, Hs746T and H596, U87-EV, U87-EGFRvIII, and xenografts E98-FM and E468, showing relative (total) MET and EGFR expression. Note that MET shows two proteins of different sizes, corresponding to the preform and the processed form of the protein8. (b) Left: MET PCR on cell lines E98, Hs746T and H596 to confirm METΔ7-8 and METΔ14 mutation status. Right: EGFR PCR on cell lines U87-EV and U87-EGFRvIII, and xenograft E468, to confirm EGFRwt and EGFRvIII status. (c) SmMIP targeted transcriptome profiling of MET (left) and EGFR (right) quantifies variant-specific expression levels in cell lines and xenografts. While E98 cells and xenografts express the METΔ7-8 variant, Hs746T and H596 predominantly express the METΔ14 variant. U87 cells express METwt transcripts. EGFRwt transcript expression is present in Hs746T, H596, U87 and E468 cells and xenografts, while the EGFRvIII variant is only present in the U87-EGFRvIII cell line.

