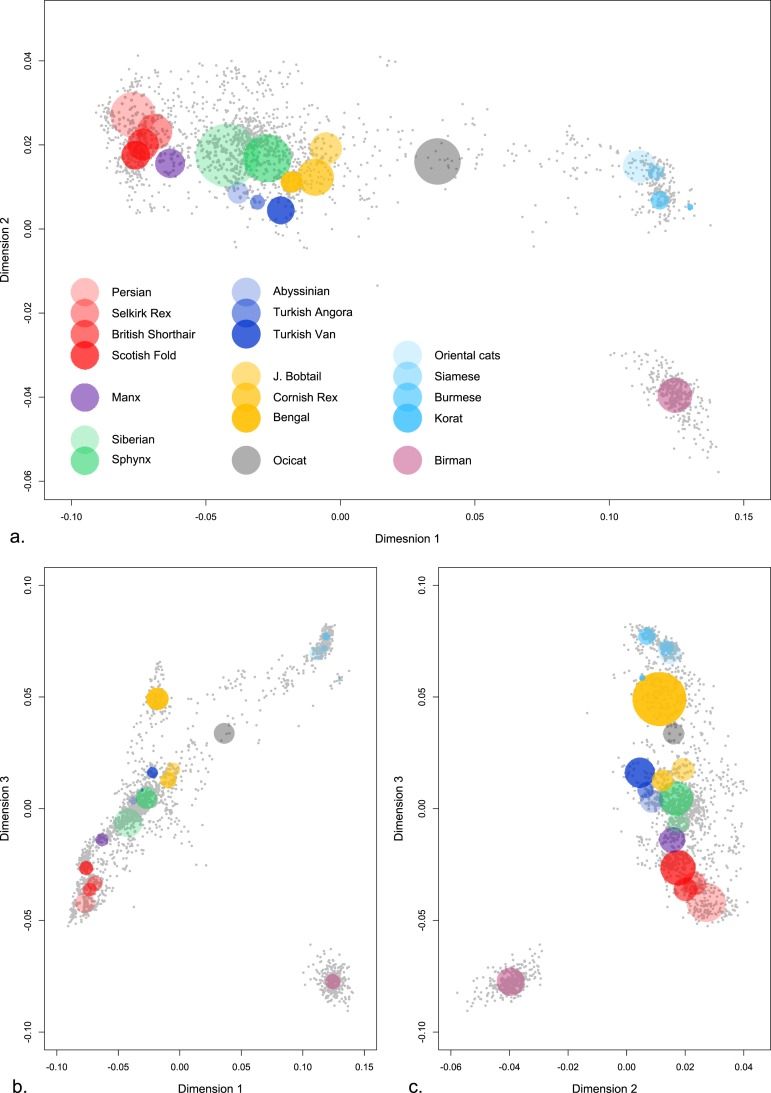
Figure 2.
Multi-dimensional scaling of cat breed genetic structure. Plots of the genetic distances between individual domestic cats in three dimensions (C1 vs. C2, C2 vs. C3, C1 vs. C3). Gray dots represent individual cats and collectively show the overall distribution of populations. Selected breeds are highlighted by a colored circle where each colored circle corresponds to a population. The positions of the circles and the sizes are drawn to qualitatively distinguish between popular cat breeds (see materials and methods). (a) dimension 1, (b) dimension 2, (c) dimension 3. The Birman breed (light purple) consistently is a highly distinctive population. Asian breeds (light blues) are highly distinct from Western breeds (reds). Ocicat (grey) are a breed developed by crossing Abyssinians with Siamese and are intermediate in the gradation of cat breeds. The MDS of each population is presented in Supplementary Figure 4.

