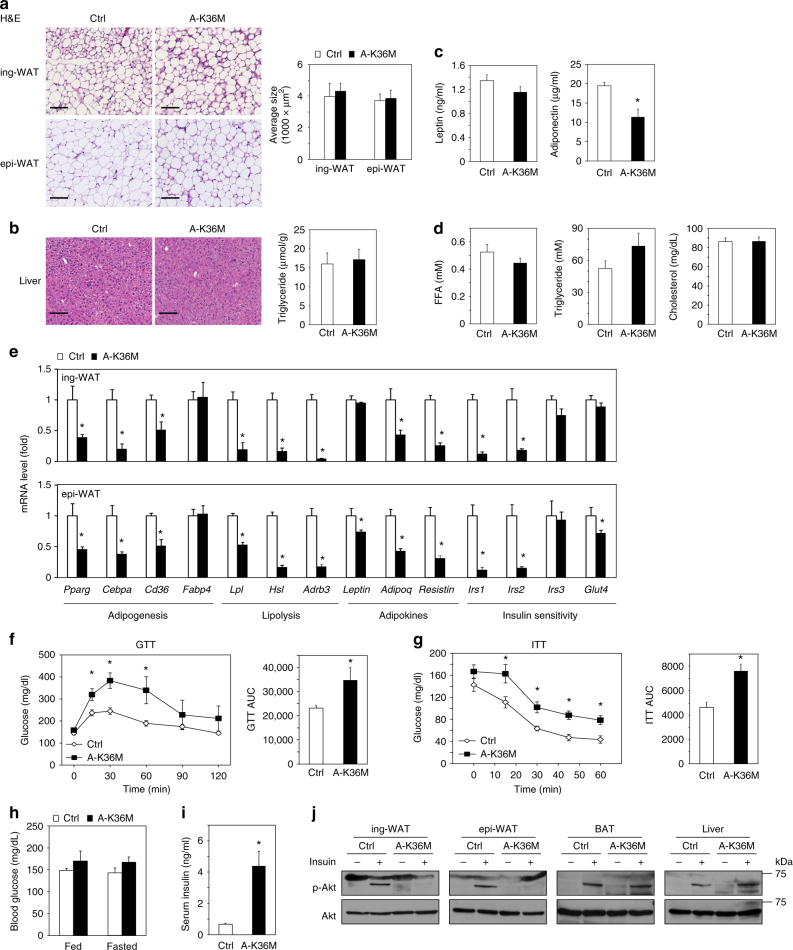
Fig. 6.
Adipose-selective expression of H3.3K36M causes insulin resistance in WAT. Eight-week-old to 10-week-old male Ctrl and A-K36M mice (n = 6 per group) were fed with regular diet. a H&E staining of ing-WAT (upper panels) and epi-WAT (lower panels). Scale bar = 100 µm. Average sizes of adipocytes in ing-WAT and epi-WAT are shown on the right. Adipocyte size was calculated using ImageJ. b H&E staining of the liver. Scale bar = 100 µm. Triglyceride content in the liver is shown on the right. c Serum leptin (left) and adiponectin (right) levels. d Serum levels of free fatty acid (FFA), triglyceride, and cholesterol. e qRT-PCR analysis of adipogenesis, lipolysis, insulin sensitivity, and adipokine genes in ing-WAT and epi-WAT. f Glucose tolerance test (GTT). Area under the curve (AUC) is shown on the right. g Insulin tolerance test (ITT). AUC is shown on the right. h Fed or fasted blood glucose levels. i Serum insulin levels in the random-fed status. j Western blot of phosphorylated Akt at Serine 473 (p-Akt) and total Akt in protein extracts of ing-WAT, epi-WAT, BAT, and liver. All values in Fig. 6 are presented as means ± SEM. Statistical comparison between groups was performed using Student’s t test. *p < 0.05

