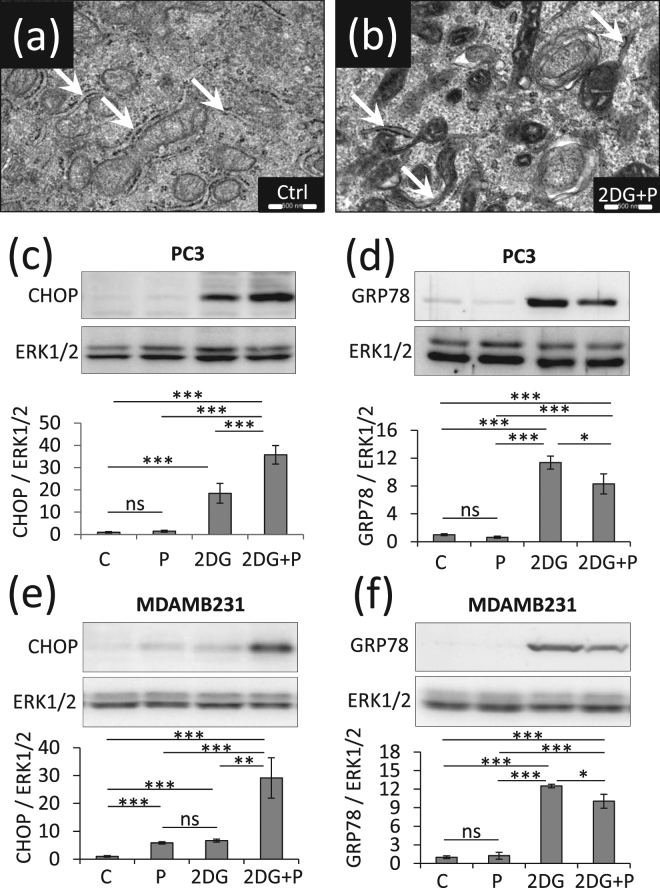
Figure 6.
2DG + P induces ER stress in PC3 and MDAMB231 cells. PC3 cells and MDAMB231 were left untreated (C) or treated with 2DG (10 mM), propranolol (P) (100 µM) or both together (P+2DG) for the indicated times. (a,b) Electron microscopy comparison of control PC3 vs PC3 treated with 2DG + P (scale bars = 500 nm). The arrows pinpoint the ER structures. In 2DG+P condition ER appears condensed. PC3 (c,d) or MDAMB231 (e,f) cells were investigated for ER stress markers CHOP (c,e) and GRP78 (d,f). Signal quantifications are normalized to Erk1/2 as a control of protein loading. CHOP is drastically increased in cells treated with 2DG+P.

