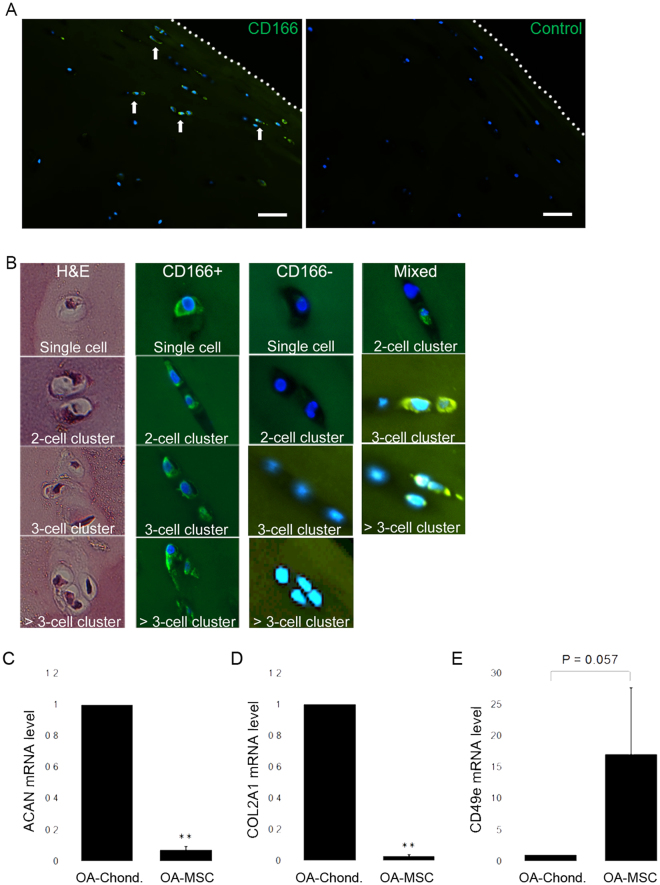
Figure 1.
In situ analysis of primary OA cartilage derived mesenchymal stem cells and their gene expression. (A) Immunofluorescent staining of human OA cartilage sections stained with Dapi (blue) and an antibody against mesenchymal stem cell surface marker CD166 (green). White arrows indicate several positive staining events. The dotted line signifies the articular surface. Control section stained with Dapi and secondary antibody only. The dotted line signifies the articular surface. Scale bar represents 100 µm. (B) H&E staining and Immunoflorescent staining of human OA cartilage sections with Dapi (blue) and CD166 antibody (green) shows representative single OA stem cells as well as stem cell clusters (Left four panels). A cell cluster was defined as multiple cells occupying the same chondron. OA chondrocytes and chondrocyte clusters are CD166− (middle four panels). Clusters containing both OA chondrocytes and OA stem cells are labeled “mixed” and shown in the right most three panels. (C) Quantification of ACAN, (D) COL2A1 and (E) CD49e mRNA levels in CD166+ primary human OA cartilage stem cells, compared with CD166− primary human OA chondrocytes. n ≥ 3. **p ≤ 0.01, relative to CD166− chondrocytes. Quantitative data are represented as mean ± SD.

