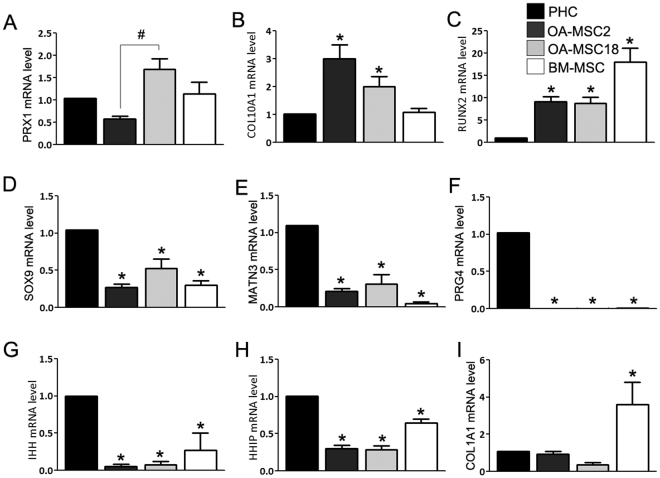
Figure 5.
Comparison of gene expression profiles of clonal OA cartilage-derived MSCs, PHCs and BM-MSCs. (A) Relative mRNA expression mesenchymal transcription factor PRX1, (B) type X collagen (COL10A1), (C) RUNX2, (D) chondrogenesis transcription factor SOX9, (E) cartilage matrix protein matrilin-3, (F) cartilage surface lubricating protein PRG4, (G) Indian hedgehog (IHH), (H) hedgehog interacting protein (HHIP), (I) and stromal marker COL1A1, in primary human chondrocytes (PHCs), bone marrow mesenchymal stem cells (BM-MSCs), OA-MSC2 and OA-MSC18. n ≥ 3. *p ≤ 0.05, relative to the chondrocyte group. #p ≤ 0.05. Data are represented as mean ± SD.

