
Figure 4.
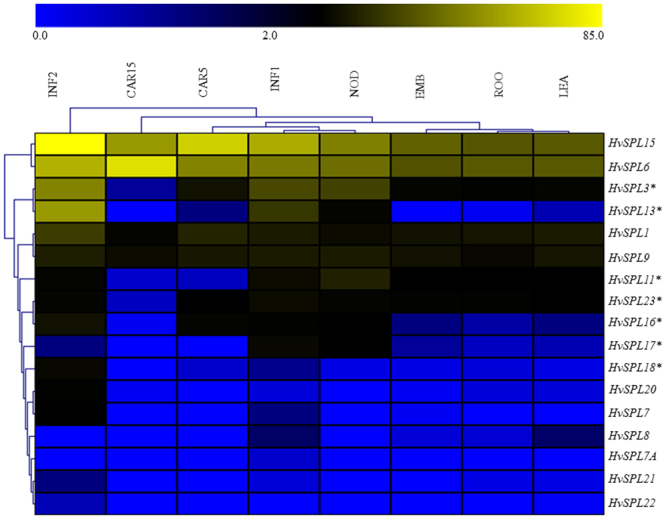
Spatio-temporal expression patterns of HvSPL genes in eight different tissues. The colour scale bar at the top of heat map represents FPKM normalized log2 transformed values based on “Morex” RNA-seq data, and represents high and low expression, respectively. EMB, ROO, NOD, LEA, INF1, INF2, CAR5 and CAR15tissues were used for expression profiling and indicated at the top of the heat map. Details about these tissues have been explained in material and method section. HvSPL genes that contain miR156 target sites are indicated by (*) asterisks.