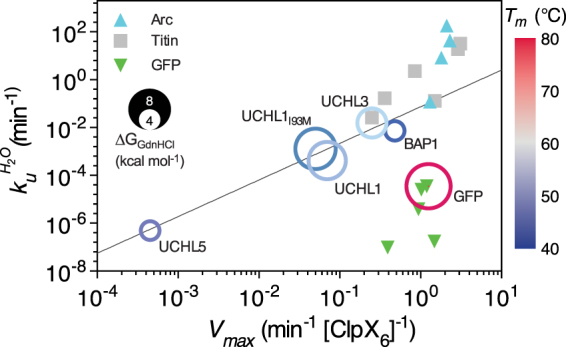
Figure 3.

Correlation plots of ClpXP-mediated proteolysis rates, Vmax, with respect to intrinsic unfolding rate . The data points of UCHs and GFP are shown in open circles with their radii proportional to the free energy of unfolding ΔGGdnHCl as indicated on the left. Since UCHL1 variants exhibited a three-state equilibrium (Table S1), their radii correspond to the sum of ΔGN-I and ΔGI-D. Furthermore, the data points are color-ramped from blue to grey to red according to their melting temperatures, Tm, as indicated on the right. The linear regression of the double-log plot of UCHs data points yields a slope of 1.48 ± 0.18 and a log() intercept of −3.10 ± 0.31 when log(Vmax) = 0 (R2 = 0.96), shown in solid black line. The previously reported data of Arc (cyan triangles), titin I27 (Titin; grey squares) and GFP (inverted green triangles) are shown for comparison (Table S4).
