
Figure 1. Global analysis of protein turnover in exponentially growing yeast.
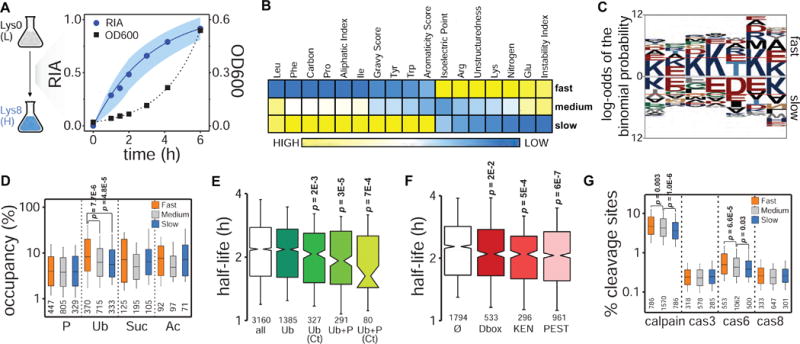
(A) Experimental design. Pulsed SILAC and dynamics of global protein labeling (RIA: relative isotopic abundance; dots: median values at each time point, shadow: standard deviations) and cell growth (OD600) for replicate 2. (B) Heatmap of Z-score transformed median values of physicochemical properties for proteins with fast, medium and slow turnover representing the lower (<25%), intermediate (25–75%), and upper (>75%) quartile ranges, respectively, of the protein half-life distribution. Only properties having significant Spearman’s correlations with protein turnover are shown (Bonferroni corrected p<0.01) (see also Figure S3). (C) Sequence analysis of the last 7 amino acids at the protein C-terminus (red lines indicate p<0.05 significance level, C-termini from all ORFs present in the SGD proteome were used as background) (see also Figure S4). (D) Comparison of PTMs occupancy (i.e. percentage of modifiable residues for which an actual modification has been reported) (P: phosphorylation; Ub: ubiquitylation; Suc: succinylation; Ac: acetylation). (E, F) Half-life distributions for proteins containing phosphorylation and ubiquitylation sites (modification information from (Christiano et al., 2014; Swaney et al., 2013)) (E) and specific degron motifs (F) compared to all proteome half-lives (Ø indicates no degrons). Median proteome half-life is represented by a grey dotted line in both plots (see also Figure S4). (G) Comparison of calpain and caspase cleavage sites density.