
Figure 3. Effects of active protein usage on turnover.
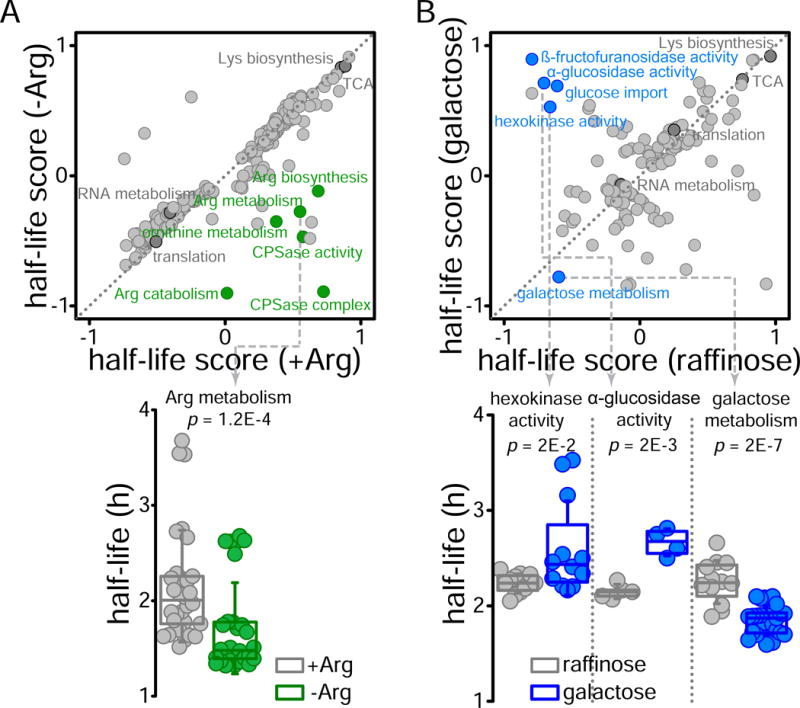
(Top) 2D annotation enrichment analysis (p<0.01) of GO terms comparing protein half-life values between cells growing in arginine rich or deficient media (A) and in raffinose or galactose as the only carbon source (B). Identity function is represented by a diagonal grey dotted line. (Bottom) Boxplots comparing the protein half-lives of members from selected GO terms showing significant differences.