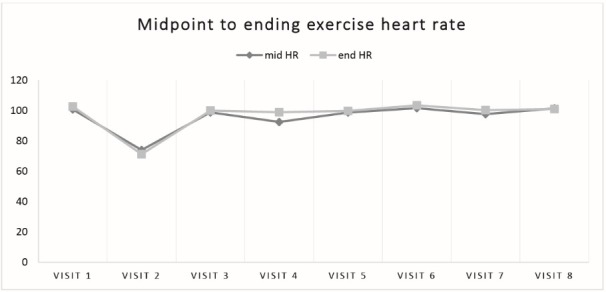
Figure 3.

Values for heart rate were recorded during exercise across the 8 visits. Each individual data point represents the mean recorded heart rate for the midpoint of the treadmill walk (dark gray line) and endpoint of the treadmill walk (light gray line). Condition description: visit 1-Exercise Only; visit 2-Texting Only; visit 3-Preferred Call; visit 4- Imposed Call; visit 5-Preferred Music; visit 6-Imposed Music; visit 7-Preferred Video; visit 8-Imposed Video.
