
Fig. 1.
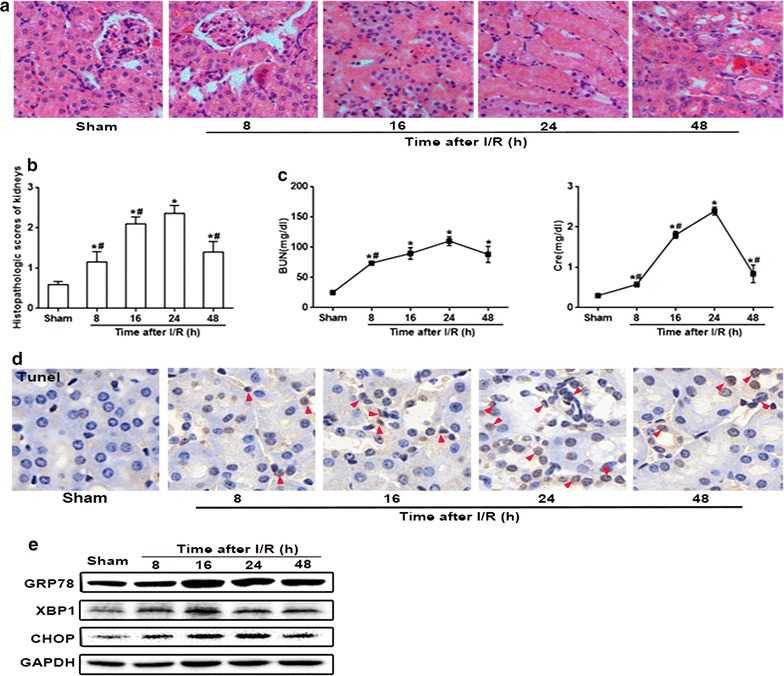
I/R-induced renal damage and renal tubular epithelial cells apoptosis were coincident with ERS activation. Samples of kidneys were obtained and evaluated after 45 min ischemia followed by different reperfusion times. a Representative light microscopy images of H&E-stained sections from every group (magnification ×200). b The graph shows histopathological score of kidneys in every group, n = 6, *p < 0.05 vs Sham group; #p < 0.05 vs 24 h after I/R group. Data are the mean values ± SEM. c Representative serum concentrations of BUN and Cre at each time point, n = 6, *p < 0.05 vs Sham; #p < 0.05 vs 24 h after I/R group. Data are the mean values ± SEM. d Representative TUNEL apoptosis assay images of kidney tissues. Brown dots were deemed positive apoptosis cells (magnification ×400; red arrow). e Renal I/R-induced ERS-related proteins (GRP78, XBP1 and CHOP) expression in renal tissues, which examined by western blotting analysis. GAPDH was used as the loading control and for band density normalization