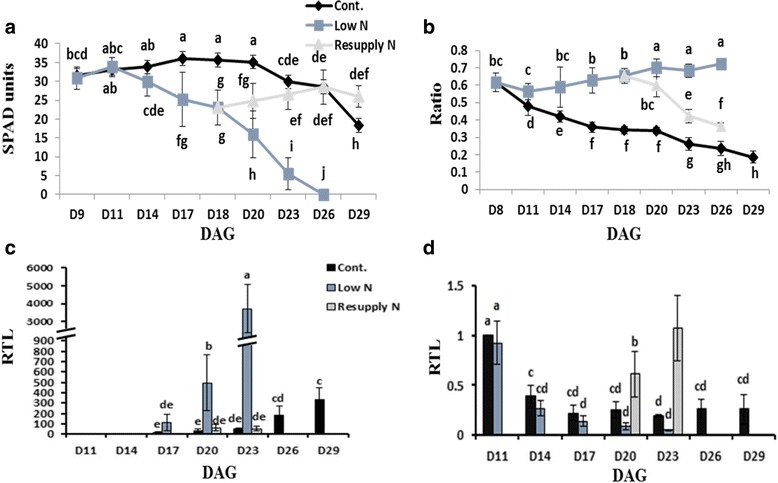
Fig. 1.

Age-dependent progression of leaf senescence under different N regimes. a Relative chlorophyll content of primary leaves as determined by SPAD measurements. b Root/shoot dry biomass ratio. c Relative transcript levels (RTL) of S40 and d of GS2. For C and D, actin was used as a reference gene. All transcript levels were normalized to those of control plants at 11 DAG. DAG: days after germination. Data represent means ±SD (n ≥ 10 plants for A and B; n = 3–5 for C and D). Different letters represent significant differences according to two-way ANOVA at p ≤ 0.05
