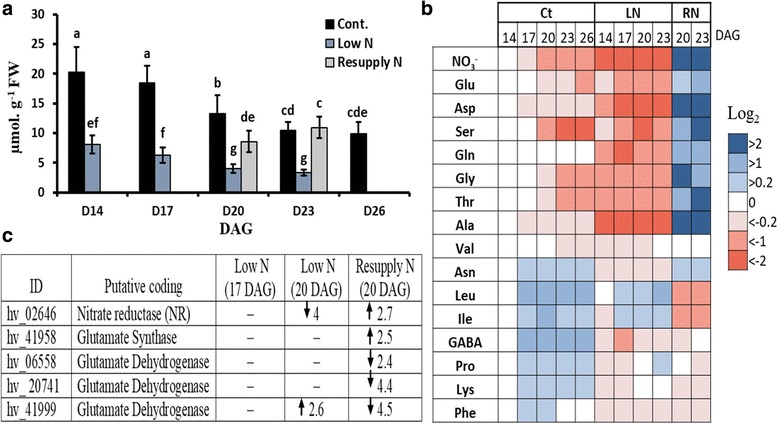
Fig. 3.

Amino acid profiling in leaves in response to N supply. a The total concentration of measured amino acids. b Heat-map of relative concentrations of individual amino acids; Results of control plants were logarithmic (log2) normalized to the values of control plants at 14 DAG; Results of low-N plants were logarithmic (log2) normalized to those of control values at the same time point, while results of N resupply plants were logarithmic (log2) normalized to those of low N values at the same time point. c Changes in transcript levels of differentially regulated genes putatively related to primary N metabolism that were determined via microarray analysis; the values represent fold-changes. Up arrow: Upregulated; down arrow: downregulated. Ct: control; LN: low N; RN: resupply of N. Bars indicate means ± SD (n = 5–9). Different letters represent significant differences according to two-way ANOVA at p ≤ 0.05
