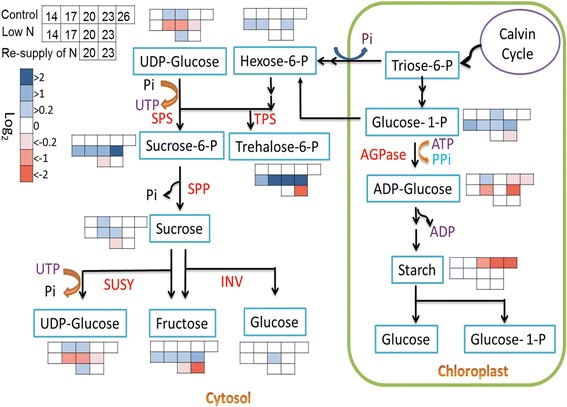
Fig. 4.

Sugar metabolism in response to the N status. Concentrations of different sugars in control plants were logarithmic (log2) normalized to the values of control plants at 14 DAG; Values from low-N plants were logarithmic (log2) normalized to those of control values at the same time point, while values of N resupplied plants were logarithmic (log2) normalized to those of low-N plants at the same time point. (n = 5–9); P ≤ 0.05; AGPase: ADP-Glc pyrophosphorylase; TPS: trehalose-6-P synthase; SPS: sucrose-phosphate synthase; SPP: sucrose-phosphate phosphatase; SUSY: sucrose synthase; INV: invertase
