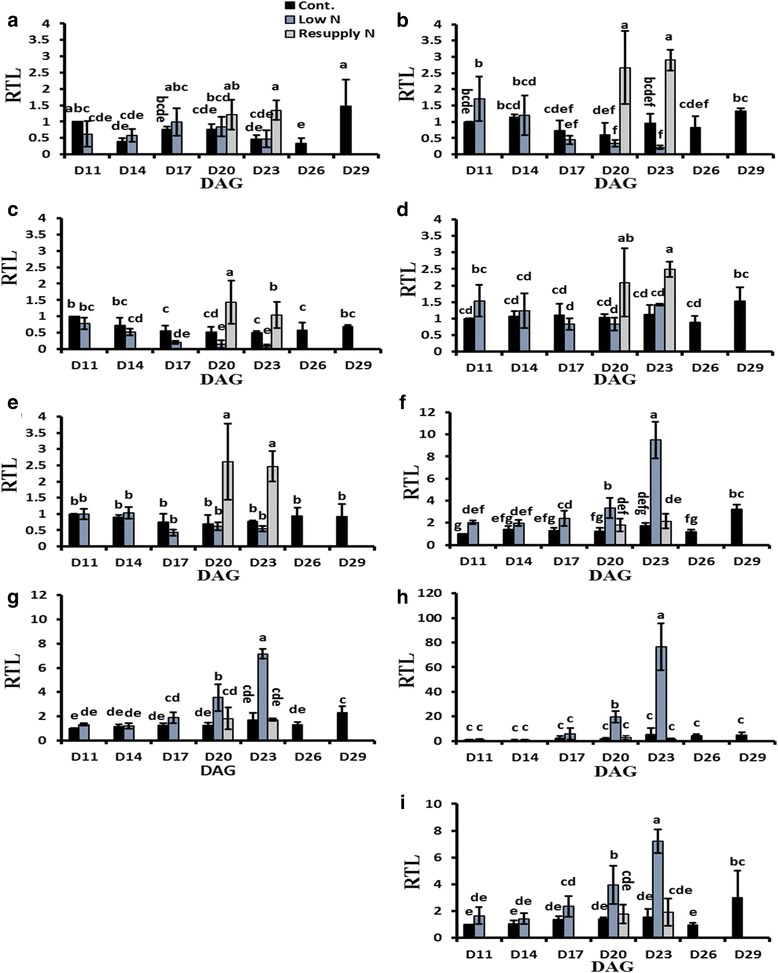
Fig. 6.

Transcriptional changes of genes involved in pyruvate metabolism under different N regimes. Transcript levels of (a) PK1; (b) PK2; (c) PDH1; (d) PDH2; (e) PDH4; (f) PPDK1; (g) PPDK2; (h) PPDK3; and (i) PPDK4 in response to N deficiency and N resupply. Relative transcript levels (RTL) of all treatments were compared to those of control plants at 11 DAG. PK: Pyruvate kinase, PDH: pyruvate dehydrogenase, and PPDK: pyruvate, orthophosphate dikinase, DAG: day after germination, Bars indicate means ± SD (n ≥ 3). Different letters represent significant differences according to two-way ANOVA at p ≤ 0.05
