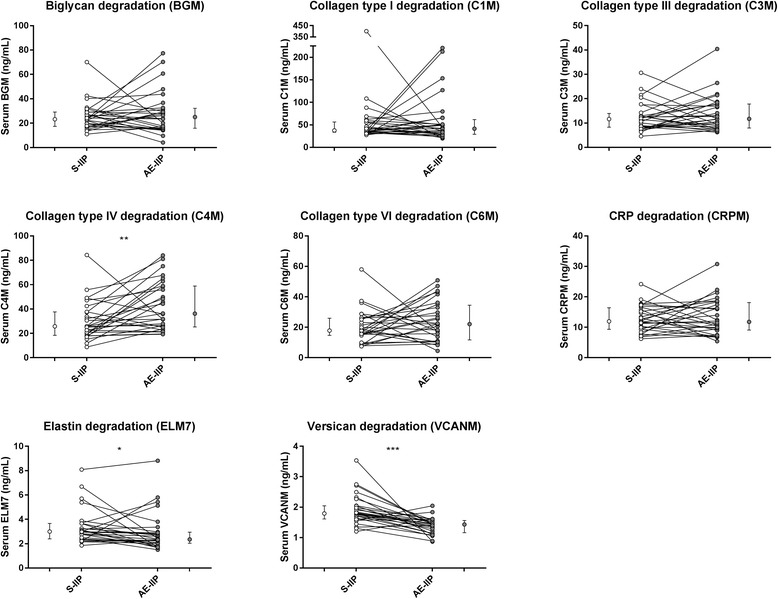
Fig. 2.

Paired serum biomarker data for the IIP population at acute exacerbation and stability. Data are shown as line plots at stability (S-IIP, white) and at acute exacerbation (AE-IIP, grey) for the paired IIP population (n = 28), with adjacent median value with interquartile range (IQR). Statistical significance was determined by paired Wilcoxon test (*p < 0.05, **p < 0.01, ***p < 0.001)
