
Fig. 4.
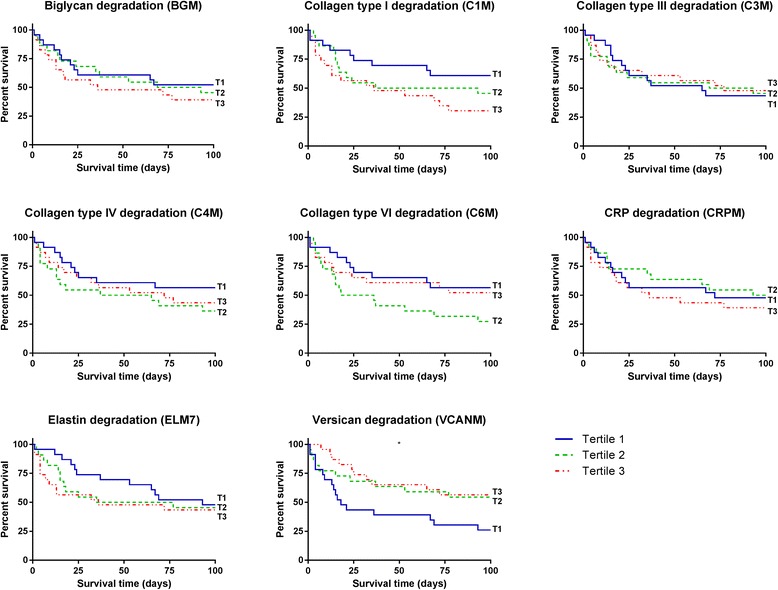
Kaplan-Meier curves for survival by biomarker tertiles at time of acute exacerbation of IIP. Asterisks indicate statistical significance between the lowest (T1), middle (T2), and highest (T3) biomarker tertiles (*p < 0.05)
Official websites use .gov
A
.gov website belongs to an official
government organization in the United States.
Secure .gov websites use HTTPS
A lock (
) or https:// means you've safely
connected to the .gov website. Share sensitive
information only on official, secure websites.
Kaplan-Meier curves for survival by biomarker tertiles at time of acute exacerbation of IIP. Asterisks indicate statistical significance between the lowest (T1), middle (T2), and highest (T3) biomarker tertiles (*p < 0.05)