
Fig. 1.
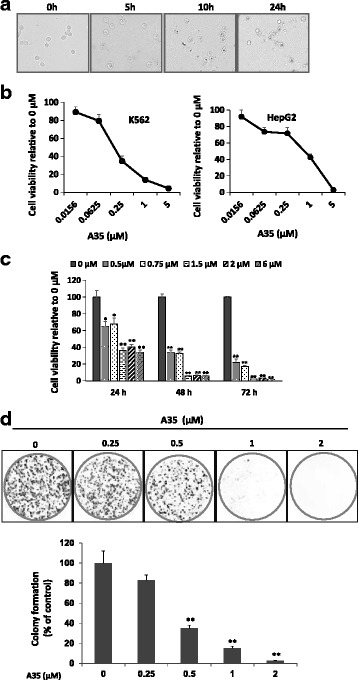
A35 suppresses cancer cell proliferation in a time- and dose-dependent manner. a The cell morphology of human leukemic K562 cells was observed at 5, 10 and 24 h after treatment with 1 μM A35. b K562 and HepG2 cells were treated with the indicated concentrations of A35, and cell survival was detected by the SRB assay. A dose-dependent curve was depicted. c Vitality of K562 cells after treatment with 0.5, 0.75, 1.5, 2 and 6 μM A35 for 24, 48 and 72 h. A time-dependent curve was plotted. d HepG2 cells were seeded in a 6-well plate at 3000 cells/well. After 24 h, various concentrations of A35 were added, and the cells continued to incubate for 7 days. Visible colonies were then counted as described in the materials and methods. Colony formation rate = (number of colonies/number of seeded cells) × 100%. *P < 0.05; ** P < 0.01