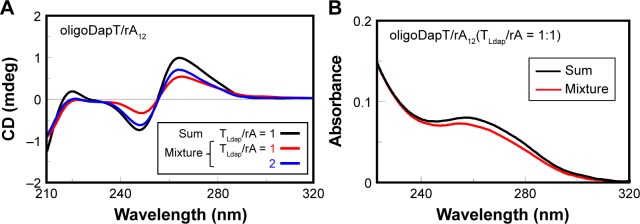
Figure 5.
CD (A) and UV (B) analyses at 5°C in a two-chamber cell (optical path = 0.875 cm) relative to the formation of the complex nucleopeptide/rA12: sum spectra (black lines) of oligoDapT (4, 4 μM in TLdap) and RNA (4 μM in rA) solutions in 10 mM phosphate buffer (pH = 7.5) and mixture spectra at TLdap/rA = 1/1 (red) and 2/1 (blue) ratios.
Abbreviations: CD, circular dichroism; UV, ultraviolet.

