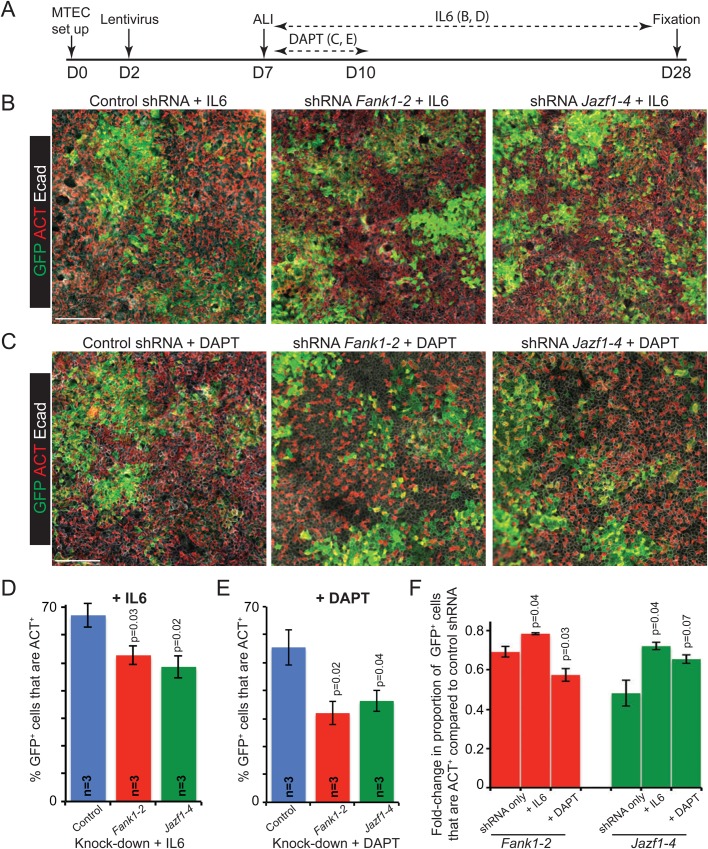
Fig. 5.
Fank1 and Jazf1 function downstream of IL6 in ciliated cell differentiation. (A) Experimental set-up for lentiviral knock-down of Fank1 or Jazf1 in MTEC ALI cultures followed by addition of IL6 or DAPT. (B) Representative antibody staining of culture day 28 in the presence of IL6. (C) Representative antibody staining of culture day 28 in the presence of DAPT. Green: GFP (lentiviral-infected cells); red: ACT (apical cilia); white: E-cadherin (lateral cell membranes). Scale bars: 50 μm. (D,E) Graphs show percentage of GFP+ ciliated cells in knock-down cultures in the presence of IL6, or DAPT. (F) Graph shows fold-change in proportion of GFP+ ciliated cells in shRNA only controls, or in the presence of IL6 or DAPT. N=3 biological replicates. Data are mean± s.e.m. P-values are for Student's t-test compared to control.

