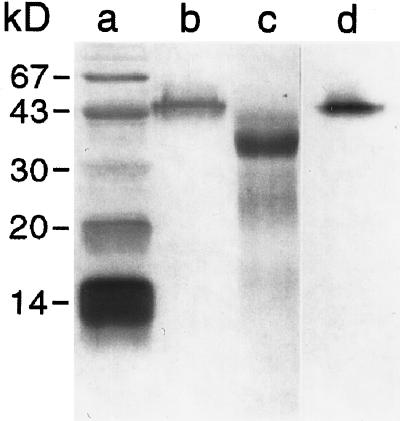
Figure 2.
SDS-PAGE analysis of purified anionic peroxidase from potato electrophoresed in a 14% acrylamide gel under denaturing conditions, before (lane b) and after (lane c) treatment with TFMS. Lane a, Molecular mass markers, including BSA (67 kD), ovalbumin (43 kD), carbonic anhydrase (30 kD), soybean trypsin inhibitor (20.1 kD), and α-lactalbumin (14.1 kD). Lane d, Activity stain using guaiacol/H2O2. Proteins in lanes a to c were visualized by silver staining. After staining, gels were dried onto cellulose acetate sheets (Bio-Rad) and scanned to generate digital images.

