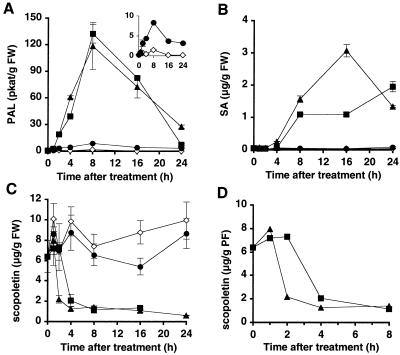
Figure 2.
Changes in PAL activity and levels of SA and scopoletin after treatment of cultured tobacco cells with the glycoprotein, α-megaspermin, or β-megaspermin. Cells were incubated in the presence of 250 nm glycoprotein (•), 250 nm α-megaspermin (▪), or 50 nm β-megaspermin (▴). PAL activity (A), SA (B), and scopoletin (C and D) were measured from untreated (⋄) and elicitor-treated cells. Each time point represents the mean ± sd of two independent experiments. D is a close view using the values (without sd values) from C. It allows a better reading of the scopoletin consumption after α-megaspermin and β-megaspermin treatments. FW, Fresh weight.

