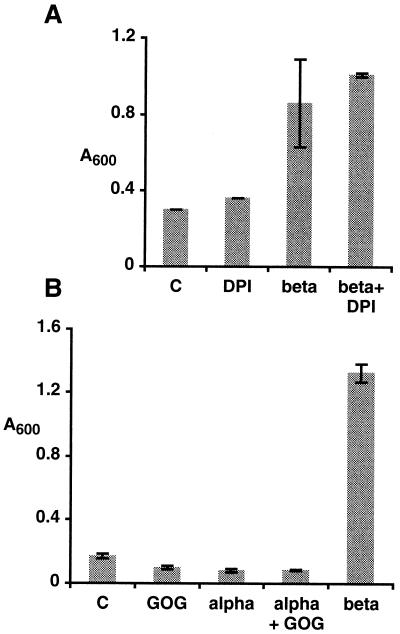
Figure 5.
Effect of DPI and of H2O2 generated by GOG on cell death. Death of treated and control (C) cells was measured after 24 h of incubation. Bars represent the means ± sd of two independent experiments. A, Cells treated with 50 nm β-megaspermin (beta), 10 μm DPI (DPI), or both (beta+DPI). B, Cells treated with 50 nm β-megaspermin (beta), 5 units/mL Glc oxidase and 5 mm Glc (GOG), 250 nm α-megaspermin (alpha), or 250 nm α-megaspermin and 5 units/mL Glc oxidase and 5 mm Glc (alpha+GOG).

